Volume I, Section 5
5 NATURAL AND INDUCED ENVIRONMENTS
{A} For a description of the notations, see Acceleration
Regimes.
This section contains the following topics:
5.1 Atmosphere
5.2 Microgravity
5.3 Acceleration
5.4 Acoustics
5.5 Vibration
5.6 Deleted
5.7 Radiation
5.8 Thermal
Environment
5.9 Combined
Environmental Effects
See the video clips associated with this section.
5.1 ATMOSPHERE
{A}
5.1.1 Introduction
{A}
This section concerns the appropriate design of spacecraft cabin atmospheres. The atmospheric design considerations subsection includes data on safe atmospheric compositions and pressures, human physiological response to these atmospheric environments, and the effects on humans of atmospheres with undesirable, or unsafe properties. The atmosphere design requirements subsection includes general design goals, atmospheric composition and pressure limits, monitoring and control of the cabin atmosphere, and limits on contaminants and toxins.
Cabin ambient conditions of temperature, humidity, and airflow are covered in
Paragraph 5.8, Thermal Environment. EVA pressure suit atmosphere is covered in
Paragraph 14.2.2.9, EVA Suit Pressure Design Considerations, and
Paragraph 14.2.3.9, EVA Suit Pressure Design Requirements.
5.1.2 Atmosphere Design Considerations
{A}
Crewmembers in the system must be provided with an environment to enable them to survive and function as a system component in space. An artificial atmosphere of suitable composition and pressure is the most immediate need. It supplies the oxygen their blood must absorb and the pressure their body fluids require.
Humans are accustomed to breathing an atmosphere that contains 21% oxygen by volume at sea-level.
Figure 5.1.2-1 shows the composition of a sea-level-equivalent atmosphere. Oxygen partial pressure must be maintained above 152 mm Hg (3 psia) for normal functioning of average crewmembers. A crewmember unacclimatized to high altitude cannot survive for extended periods at total pressures lower than 417 mm Hg (8 psia). By breathing pure oxygen, they can survive at a total pressure of about 152 mm Hg (3 psia). At a total pressure of 760 mm Hg (14.7 psia) the oxygen supply is similarly inadequate when the concentration of oxygen is below about 11%. Too little oxygen (hypoxia) induces sleepiness, headache, the inability to perform simple tasks, and loss of consciousness. Too much oxygen (hyperoxia) can also be harmful. Prolonged breathing of pure oxygen at sea level pressure (and perhaps even at lower pressures) can eventually produce inflammation of the lungs, respiratory disturbances, various heart symptoms, blindness, and loss of consciousness.
Figure 5.1.2-2 shows human performance limits versus total pressure and oxygen concentration. Maximum range in total pressure varies from 760 mm Hg (14.7 psia) with an N2-02 mix, to approximately 190 mm Hg (3.6 psia) 100% 02. The lower pressure limits are determined primarily by the requirements for maintaining alveolar oxygen levels. At 190 mm Hg (3.6 psia) total pressure in a 100% oxygen atmosphere, the O2 partial pressure is near normoxic or 103 mm HgPO2 (2.0 psia) in the alveoli (the remainder of the lung being filled with CO2 and water vapor). If pressures less than 190 mm Hg (3.6 psia) are considered, the crew will need pressure suits and 100% oxygen under pressure. Using pressures of less than 760 mm Hg (14.7 psia) may provide protection from bends in the event of decompression (both accidental and intentional) because partial pressure of N2 (pN2) decreases in proportion to barometric pressure (pB). This aspect of atmosphere selection assumes considerable importance if a crewmember must leave the vehicle and perform tasks in space.
Figure 5.1.2-1 Standard Sea - Level
Atmosphere
| Parameter |
Standard Sea-Level Atmosphere Values |
| kPa |
psia |
mmHg |
| Total Pressure |
101.36 |
14.70 |
760.0 |
| Oxygen partial pressure |
21.37 |
3.04 |
151.3 |
| Nitrogen partial pressure |
78.60 |
11.44 |
591.7 |
| Water vapor partial pressure |
1.38 |
0.2 |
10.7 |
| CO2 partial pressure |
0.04 |
0.0058 |
0.3 |
|
Note: Water vapor partial pressure at 74 deg. F and 50% relative
humidity
|
Reference: 198, p. 27; NASA-STD-3000 55
Figure 5.1.2-2 Relationship Between
Percentage of Oxygen in Atmosphere of Space Vehicle and Total Pressure of that
Atmosphere
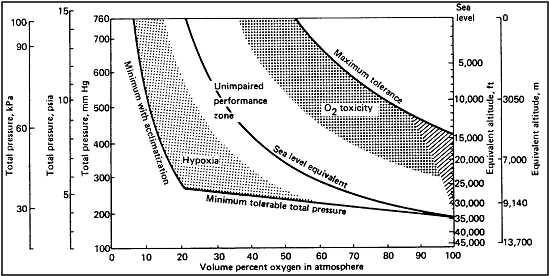
Reference: 6, Figure 3.9, p. 37; NASA-STD-3000 56
Considering crew needs only, space cabin pressure is sufficient in the range between 190 and 380 mm Hg (3.75 - 7.3 psia). In this range, crewmembers need not wear protective equipment, and as long as the amount of oxygen in the vehicle cabin provides an alveolar partial pressure of O2 (pO2) of at least 103 mm Hg (1.9 psia), the blood will have an oxygen level equivalent to that at sea level.
The use of low ambient pressure and 100% oxygen at the above pressure is attractive to the designer because it saves weight, simplifies engineering and monitoring, and reduces atmospheric gas leak rates. However, there is considerable fire hazard involved in using 100% oxygen in the pressure range of 190 to 380 mm Hg (3.75 - 7.3 psia). At 190 mm Hg (3.75 psia), 100% oxygen is essential to maintain the required alveolar PO2. At 380 mm Hg (7.3 psia), the oxygen can be diluted with an inert gas, such as nitrogen or helium, to about 50% of the total pressure, the inert gas acting as a retardant in case of fire. The burning time is approximately doubled by going from 100% oxygen at 190 mm Hg (2.75 psia) to a nitrogen-diluted atmosphere at 380 mm Hg (7.3 psia).
(Refer to Paragraph 6.6, Fire Hazards, for more details on fire protection and control.)
The current design approach for a manned spacecraft atmosphere specifies a pressure of 760 mm Hg (14.7 psia). This environment offers an advantage in that chemical or biological experiments performed in the cabin will not have the added complication of dealing with a nonstandard pressure or composition.
The following paragraphs give additional details on the atmospheric design consideration factors previously discussed.
5.1.2.1 Safe Atmospheres Design Considerations
{A}
Humans can survive in a wide range of atmospheric compositions and pressures. Atmospheres deemed sufficient for human survival are constrained by the following considerations:
a. There must be sufficient total pressure to prevent the vaporization of body fluids.
b. There must be free oxygen at sufficient partial pressure for adequate respiration.
c. Oxygen partial pressure must not be so great as to induce oxygen toxicity.
d. For long durations (in excess of two weeks) some physiologically inert gas must be provided to prevent atelactasis.
e. All other atmospheric constituents must be physiologically inert or of low enough concentration to preclude toxic effects.
f. The breathing atmosphere composition should have minimal flame/explosive hazard.
More restrictive limits may be applied to atmospheric parameters to ensure crew health. Crew comfort and efficiency may be enhanced by imposing yet tighter constraints.
Paragraphs 5.1.2.1.1, Gas Composition and Pressure Design Considerations, and
5.1.2.1.4, Human Responses to the Diluent Gas Environment Design Considerations, address the selection of atmospheric parameters and discuss crew health and comfort impacts.
5.1.2.1.1 Gas Composition and Pressure Design Considerations
{A}
Figure 5.1.2.1.1-1 shows optimum sea-level atmospheric parameters. Although an Earth-like atmosphere is not the only possibility, it is useful to consider such an atmosphere as a baseline.
The most basic requirements applicable to any spacecraft cabin atmosphere are that it provide:
a. Free oxygen of a suitable partial pressure for metabolic use.
b. A cabin absolute pressure sufficient to prevent vaporization of body fluids (ebullism), which occurs at approximately 45 mm Hg (0.9 psia) at
37° C (95° F).
Earth's atmosphere provides a physiologically inert gas, nitrogen, which comprises 78% of Earth's air by volume. Best candidate atmospheres will contain one or more of the. following physiologically inert diluent gases: nitrogen, helium, neon, argon, krypton, xenon, or hydrogen. The diluent gas can serve several functions:
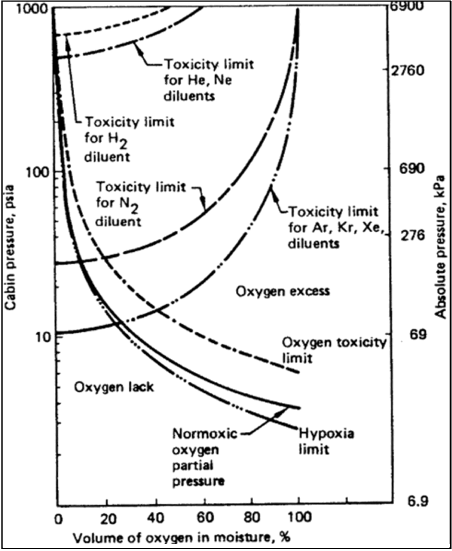
Figure 5.1.2.1.1-1 Range of
Permissible Cabin Atmosphere Absolute Pressure vs. Oxygen Concentration
Reference: 20, pp. 2, 42, 55; 111,
p. 863; 198, p. 27; 264,
Table 11.2, para. 11.1.1/4; 268, p. 5; NASA-STD-3000 57
1. It can be used to increase cabin total pressure without necessarily increasing oxygen partial pressure - this is important in vehicles that operate in a high absolute pressure ambient, e.g., a diving bell or a hypothetical manned lander on Venus.
2. In the event of a closed pocket of gas occurring in the crewmember's body, collapse of the pocket may occur. This may occur in the middle ear if the middle ear is not periodically ventilated (ear clearing). It can also occur in small segments of the lungs during high stress, since the oxygen and carbon dioxide present in the pocket are absorbed rapidly. A diluent gas added to the mixture will be absorbed more slowly, and will help prevent such a collapse.
3. Experiments, particularly in life sciences, may be sensitive to atmospheric parameters. A choice of Earth normal atmosphere [i.e., 760 mm Hg (14.7 psia) and 79% nitrogen, 21% oxygen, plus minor constituents] would typically provide a better laboratory test environment than pure oxygen. Normal atmosphere would allow use of standard laboratory equipment.
4. Except for hydrogen, the diluent gas(es) in the cabin atmosphere will act as a suppressant in case of fire.
5.1.2.1.2 Gas Pressure Design Considerations
{A}
Figure 5.1.2.1.1-1 plots absolute cabin pressure as a function of percent oxygen in the mixture. Shown in the figure are:
a. Normoxic line which will typically represent the optimum pressure concentration combination.
b. Upper and lower pressure limits imposed by danger of oxygen toxicity and hypoxia, respectively.
c. Upper pressure limits imposed by danger of toxicity of various diluent gases.
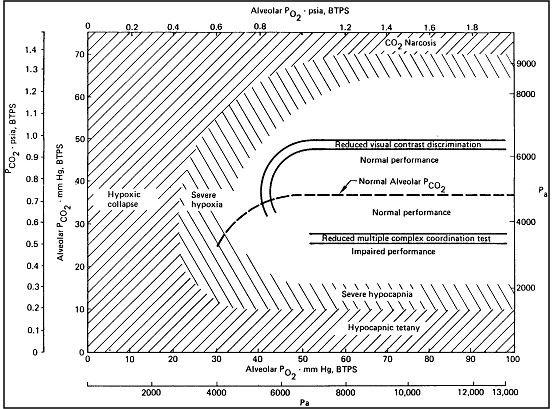
Carbon dioxide will be present as a byproduct of respiration. Figure 5.1.2.1.2-1 plots alveolar partial pressure of CO2 against alveolar partial pressure of 02. Shown on the graph are relations between CO2-02 composition and human performance response. The normal 36 mm Hg (0.7 psia) alveolar partial pressure corresponds to approximately 3 mm Hg (0.006 psia) CO2 cabin partial pressure.
5.1.2.1.3 Mission Related Design Considerations
{A}
Various flight regimes may influence the choices a designer makes in selecting an atmosphere. Some of the possible considerations are:
a. Prelaunch - Contamination from ambient atmosphere during boarding may influence pressurization or depressurization schedule. Low pressure cabins may require oxygen prebreathe.
b. Launch - The possibility of oxygen atelectasis during high-g stress, with a 100% O2 atmosphere, suggests including a diluent gas in the mixture. The shallow breathing that may result from high-g loading may dictate a higher oxygen concentration or an increased ventilation rate.
c. Short Flights - Greater ranges of atmospheric parameters (e.g., CO2 partial pressure and pure oxygen atmospheres) may be tolerated in short flights as the detrimental effects of these are time dependent.
d. Long Flights - For longer flights, tolerance to irritating or toxic substances are reduced, trace contaminants become more important, and crew comfort of greater concern.
e. Entry/Landing - Same as launch, plus consideration of ambient conditions if landing in extraterrestrial environment.
f. Post Landing - If on Earth, reintroducing ambient atmosphere on an appropriate schedule may be desirable while waiting for debarkation. If not on Earth, ambient conditions, EVA operations, experiments, etc., may influence atmosphere design.
g. Hyperbaric Treatment - The rate of pressurization during hyperbaric treatment should not result in a differential pressure across a crewmember's chest in excess of 80 mm Hg (1.5 psi), or in excess of 40 mm Hg (0.75 psi) for a period of longer than five seconds. Decompression scheduling and gas composition changes in the chamber depend on atmospheric composition.
O2 toxicity is the main concern in hyperbaric therapy regimes. See Reference
280 for specific protocols.
Figure 5.1.2.1.2-1 Relationship
of Alveolar O2 and CO2 Composition to Performance
Reference: 29, pp. 2, 42, 55; 111,
p. 863; 264, Table 11.2, para. 11.1.1/4;
268, p. 5; NASA-STD-3000 58
5.1.2.1.4 Human Response to the Diluent Gas Environment Design Considerations
{A}
A choice of atmospheric composition that contains a diluent gas other than nitrogen may have associated side effects for a spacecraft crew. Paragraphs
5.1.2.1.4.1 through 5.1.2.1.4.3 discuss metabolic, thermal, and vocal factors that may impact crew performance.
Figure 5.1.2.1.4-1 lists some physical properties of selected inert gases.
Figure 5.1.2.1.4-1 Physical Properties of Inert Gases
| Element |
Helium |
Nitrogen |
Neon |
Argon |
Krypton |
Xenon |
| Symbol |
He |
N2 |
Ne |
A |
Kr |
Xe |
| Atomic number |
2 |
7 |
10 |
18 |
36 |
54 |
| Molecular weight |
4.00 |
28.00 |
20.18 |
39.94 |
83.80 |
131.3 |
| Density at 101.3 kPa (1 atm) and 0°C ( 32°F ) |
| Kg/m3 |
0.1784 |
1.251 |
0.9004 |
1.784 |
3.708 |
5.851 |
| (lb/ft3) |
(0.011) |
(0.078) |
(0.056) |
(0.111) |
(0.231) |
(0.365) |
| Viscosity
at 0 deg C ( 32°F ) and 101.3 kPa (1 atm) |
| Pascal-second |
19.4x10⁻⁵ |
17.5x10⁻⁵ |
31.1x10⁻⁵ |
22.2x10⁻⁵ |
25x10-5 |
22.6x10⁻⁵ |
| (Centipoise) |
(0.194) |
(0.175) |
(0.31) |
(0.222) |
(0.250) |
(0.226) |
| Thermal conductivity at 0°C ( 32°F), 101.3 kPa (1 atm) |
| Kcal/M.hr °C |
0.1252 |
0.0209 |
0.0407 |
0.0145 |
0.0077 |
0.0045 |
| (BTU/ft. hr. °F) |
(0.0840) |
(0.0140) |
(0.0273) |
(0.0097) |
(0.0052) |
(0.0030) |
| Bunsen solubility coefficients: |
| In water at 38°C |
0.0086 |
0.013 |
0.0097 |
0.026 |
0.045 |
0.085 |
| In olive oil at 38°C |
0.015 |
0.061 |
0.019 |
0.14 |
0.43 |
1.7 |
| In human fat at 37°C |
? |
0.062 |
0.020 |
? |
0.041 |
1.6 |
| Oil, water solubility ratio |
1.74 |
4.69 |
1.95 |
5.38 |
9.56 |
20.0 |
Reference: 42, Table 2-1,
p. 53; NASA-STD-3000 59
5.1.2.1.4.1 Metabolic Factors Design Considerations
{A}
All gases considered for the role of diluent in an atmosphere must be physiologically inert,
i.e., relatively little metabolic response to the diluent under normal conditions. At higher pressures, however, the diluent gases exhibit toxic effects.
Figure 5.1.2.1.1-1 shows approximate upper pressure limits for use of various diluents. At pressures above these limits, the diluent can act as a depressant. Standard hyperbaric treatment protocols only require total pressures up to 4560 mm Hg (88.2 psia).
5.1.2.1.4.2 Thermal Factors Design Considerations
{A}
With the exception of helium, the diluent gases considered for use in cabin atmospheres do not present difficulties with thermal regulation significantly different from nitrogen.
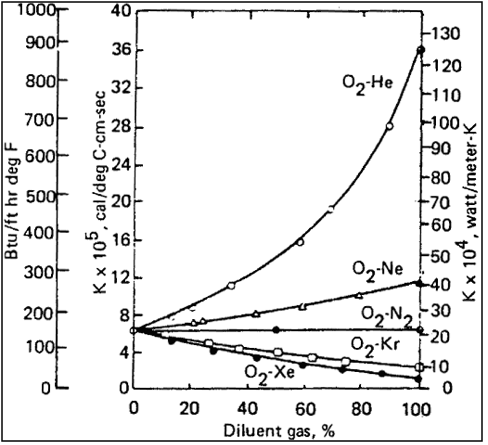
The thermal conductivity of helium is six times that of nitrogen. For this reason, experience has shown that air temperatures must be maintained at least 2 to 3 C (4 to 5 F) higher than normal for subjects at rest.
Figure 5.1.2.1.4.2-1 shows thermal conductivity for several diluent gas atmospheres against diluent gas concentration.
(Refer to Paragraph 5.8, Thermal Environment, for more details on the atmospheric thermal environment.)
Figure 5.1.2.1.4.2-1 Thermal
Conductivity of Binary Gas Mixtures Containing O2 at 30 deg C
Reference: 92, Figure 2-18, p.
58; NASA-STD-3000 60
5.1.2.1.4.3 Vocal Factors Design Considerations
{A}
The low density of helium-oxygen mixtures induces an increase in the frequencies of the human voice. At high-percentage mixtures of helium, substantial problems with speech intelligibility may be encountered. In these circumstances, partial mixes with nitrogen or neon added to the heliox (helium-oxygen) mixture will be of benefit. Electronic processing has also been used to improve communication clarity.
5.1.2.2 Dangers Associated with Unsafe Atmospheres Design Considerations
{A}
Paragraphs 5.1.2.2.1 through 5.1.2.2.3 discuss the effects on humans of atmospheres that are unsuitable for crew health and comfort. Included are the effects of excess and insufficient
O2 and CO2 , insufficient and excess total pressure, and contaminants and toxicity.
5.1.2.2.1 Adaptive Physiological Responses Design Considerations
{A}
Adaptive physiological responses to unsafe atmospheres are considered to be those changes that take place in the body physiology to adapt to the outside stimulus, as opposed to nonadaptive responses, that indicate physical damage.
5.1.2.2.1.1 Hypoxia Design Considerations
{A}
The condition of insufficient oxygen to support normal physiological functioning is called hypoxia. The only oxygen stored by the body is found in the hemoglobin in the blood stream, and some amount in the myoglobin of red muscle tissues. Muscles can function temporarily without oxygen but build up toxic fatigue products that limit their activity.
The central nervous system, including the brain and eyes are particularly sensitive to oxygen deficiency, and cannot function without oxygen. Acute impairment of brain function occurs within 13 seconds whenever the alveolar oxygen tension drops below about 33 mm Hg (0.5 psia).
Man can acclimatize to hypoxia (adaptive response) at relatively low altitudes (pressures) but not above 5500 m (18000 ft) or 379 mm Hg (7.34 psia) and normal air composition.
Figure 5.1.2.2.1.1-1 shows atmospheric pressure/ composition combinations where hypoxia is likely to occur.
Figure 5.1.2.2.1.1-2 lists physiological effects relative to lack of oxygen.
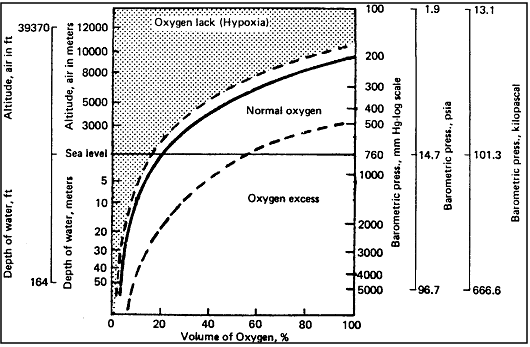
Note: The effects of falling oxygen pressure is insidious, as it dulls the brain and prevents realization of danger.
|
Reference: 111, p. 863; 92,
p. 38; NASA-STD-3000 62
Oxygen partial pressure
mm Hg (psia) |
Effect |
| 160 (3.1) |
Normal sea level atmosphere level |
| 137 (2.7) |
Accepted limit of alertness. Loss of
night vision. Earliest symptoms is dilation of the pupils. |
| 114 (2.2) |
Performance seriously impaired.
Hallucinations, excitation, apathy. |
| 100 (1.9) |
Physical coordination impaired, emotionally
upset, paralysis, loss of memory. |
| 84 (1.6) |
Eventual irreversible unconsciousness. |
| 0-46 (0-0.89)
|
Anoxia -- near-immediate unconsciousness,
convulsions, paralysis. Death in 90 to 180 seconds. |
|
Note: The effects of falling oxygen pressure is insidious, as it dulls
the brain and prevents realization of danger.
|
Reference: 92, P. 38; 111,
p. 863; NASA-STD-3000 64
5.1.2.2.1.2 Night Vision Abnormalities Design Considerations
{A}
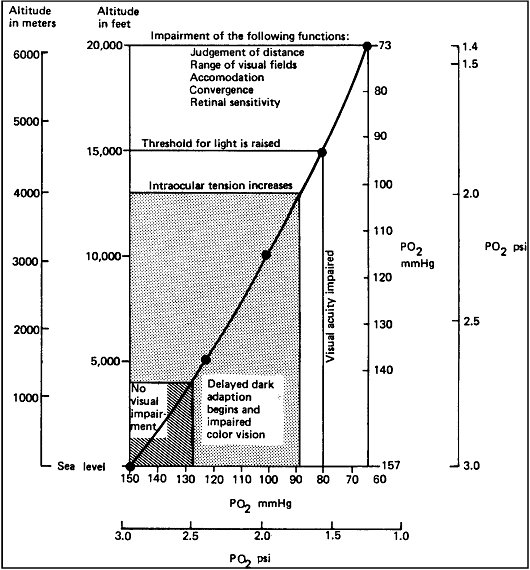
The visual functions of a human are particularly sensitive to hypoxia. The retina is the most
O2 sensitive tissue in the body.
Figure 5.1.2.2.1.2-1 shows some thresholds of visual determination.
(Refer to Paragraph 4.2, Vision, for other vision design considerations and requirements).
Figure 5.1.2.2.1.2-1 Impairment
of Visual Functions Produced by Hypoxia
Reference: 11, pp. 10-50; NASA-STD-3000 63
5.1.2.2.1.3 Oxygen Toxicity (Hyperoxia) Design Considerations
{A}
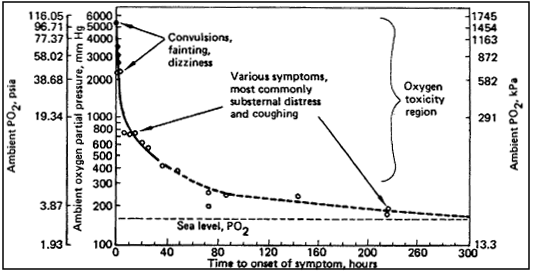
For the purpose of this document, the condition of oxygen toxicity (hyperoxia) will be considered as associated with oxygen partial pressures between sea level normal, 160 mm Hg (3.1 psia), and the 310 mm Hg (6 psia) limit.
Figure 5.1.2.2.1.3-1 shows times to onset of symptoms. As shown in the figure, the symptoms in this region will generally be respiratory. At pressures of oxygen at around 253 mm Hg (5 psia), changes in red blood cell fragility and cell wall permeability have been reported at long periods of exposure.
Figure 5.1.2.2.1.3-1 Approximate
Time of Appearance of Hyperoxic Symptoms as a Function of Oxygen Partial Pressure
Reference: 92, Figure 2-10, p. 46; NASA-STD-3000 64
5.1.2.2.1.4 Chronic CO2 Toxicity Design Considerations
{A}
Long-term exposures to CO2 concentrations in the range of 1-1.5% will generally not produce significant changes in blood pressure, pulse, or temperature (chronic
CO2 toxicity). Such exposures have been noted to produce significant alterations such as respiratory acidosis, increased carbonate retention in bone tissue, increased cortical adrenal activity, and decreased cardiovascular function. No outward apparent symptoms would be expected at this concentration.
At CO2 concentrations of about 3%, crewmembers will typically exhibit increased motor activity, excitement, euphoria, mental acuity and sleeplessness for about a day, followed by headache, mental depression and cloudiness, decreased memory and attentiveness, and decreased appetite. Typically, after the third day, there will be some return to normal.
Generally, subjects have felt normal after a week of breathing normal air again, and the characteristics have returned to normal after a month.
5.1.2.2.1.5 Acute CO2 Toxicity Design Considerations
{A}
Figure 5.1.2.2.1.5-1 shows effects of increased
CO2 concentration on respiration volume, rate, and pulse rate. It has been noted that individuals with a relatively large tidal volume and slow respiratory rate show less respiratory and sympathetic nervous system responses while breathing low concentrations of
CO2 .
Figure 5.1.2.2.1.5-2 shows CO2 partial pressure rate increase, with loss of
CO2 removal function, for space modules of various volumes and configurations. Limits are defined as operational, 90-day degraded, 28-day emergency, and critical. Other effects of increased
CO2 concentration (in the range of 3-7%) are:
a. Reduced body temperature, typically 0.5° - 1.5° C (1° - 3° F).
b. Increased urine production (up to three times normal rate).
c. Reduced aerobic capacity (13% - 15% reduction).
Acute CO2 toxicity symptoms include dyspnea, fatigue, impaired concentration, dizziness, faintness, flushing and sweating of face, visual disturbances, and headache. Exposure to 10% or greater concentrations can cause nausea, vomiting, chills, visual and auditory hallucinations, burning of the eyes, extreme dyspnea, and loss of consciousness. Without therapeutic support, respiratory depression, convulsion, shock, and death may result from
CO2 concentrations above 10%.
Figure 5.1.2.2.1.5-1 Effects
of Increased Carbon Dioxide Inhalation
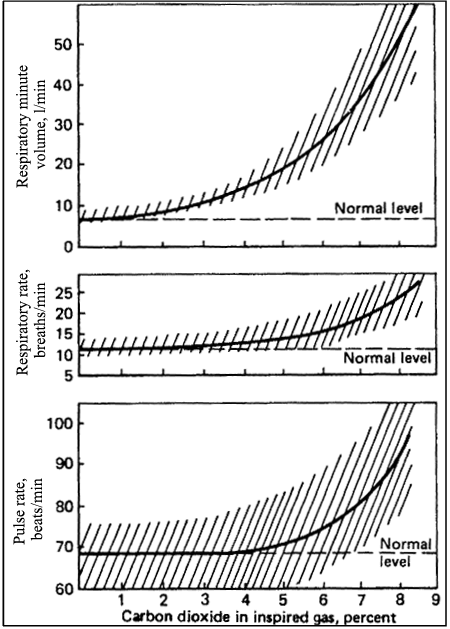
Note: Subjects at rest, hatched areas represent deviations from the
mean.
|
Reference: 6, p. 41; 11,
pp. 10-64; 21, p. 3; NASA-STD-3000 65
Figure 5.1.2.2.1.5-2 Carbon
Dioxide Partial Pressure Increase without Carbon Dioxide Removal
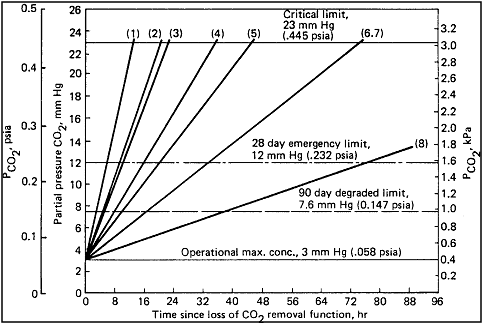
|
|
Cases Cited
|
|
Curve
|
No. Mod./vol. (1)
|
Number of crew
|
Notes:
|
| 1 |
1 smod |
8 |
1 Smod=1 short
module=81.3 m3 (2873 ft3)
|
| 2 |
1 smod
|
4 |
|
| 3 |
1 lmod
|
8 |
1 lmod=1 long
module=176.7 m3 (6244 ft3)
|
| 4 |
1/2 spst
|
8 |
1 spst=1 space
station=548.7 m3 (19,387 ft3)
|
| 5 |
1 lmod
|
4 |
|
| 6 |
1/2 spst |
4 |
|
| 7 |
1 spst
|
8 |
|
| 8 |
1 spst
|
4 |
|
|
Assumptions:
1. 1.0 Kb (2.2 lb) CO2/person day metabolic rate
2. CO2 leakage overboard negligible
3. Delta configuration volumes
a. 81.3 m3 (2,873 ft3) short module
b. 176.7 m3 (6244 ft3) long module
c. 72.8 m3 (2,572 ft3) logistics module
d. 21.7 m3 (768 ft3) tunnel
e. 8.4 m3 (296 ft3) interface module
f. 548.7 m3 (19,387 ft3) space
station
4. Equipment volume equals 10% of volume
5. 3 mm (0.58 psia) atmosphere pressure
|
Reference: 322; NASA-STD-3000 66
5.1.2.2.1.6 CO2 Withdrawal Design Considerations
{A}
CO2 withdrawal symptoms can be experienced after the cessation of certain exposures to
CO2 and can result in even greater functional impairment than the exposure itself. Headaches of varying severity are common. Withdrawal from more acute exposures may cause dizziness. Symptoms are more marked during acute exposures to 5-10%
CO2 than during chronic exposures to CO2 concentrations below 3%. In the extreme case, profound hypertension and grave cardiac arrhythmias may occur. It has been observed that subjects recover from
CO2 exposure better when breathing oxygen than when breathing air.
5.1.2.2.1.7 Dysbarism Sickness Design Considerations
{A}
Any diluent gas present in the cabin atmosphere will establish an equilibrium concentration in body tissues. If the ambient pressure is lessened, a certain amount of the diluent will come out of solution. If the pressure change (dysbarism) takes place slowly enough, the diluent can be transported away normally by the bloodstream. However, if the pressure change is rapid enough through a large differential, the diluent may come out of solution rapidly and form gas bubbles. A major consequence of this phenomenon is known as decompression sickness.
5.1.2.2.1.7.1 Evolved Gas Dysbarism Design Considerations
{A}
The varied symptoms and pathological physiology of the effects of dysbarism can be divided into several categories under decompression sickness: bends, chokes, skin manifestations, circulatory collapse, and neurological disorders. The relative incidence of the different symptoms varies with the type and partial pressure of the gas at equilibrium, the level of exercise, and final pressure.
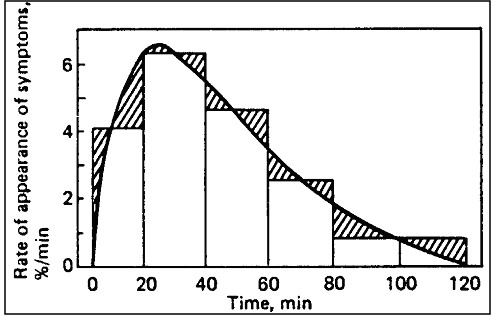
Figure 5.1.2.2.1.7.1-1 shows the percent of exposed subjects per minute experiencing new symptoms (bends of grade 2 or > and chokes) at given times after exposure to 38,000 ft. at rest from previous sea level conditions with no preheating. The curve is thought to reflect the size history of a typical gas bubble in the sensitive tissue for these specific conditions.
Tests with EVA representative decompression, work rates, and prebreathe show a considerably delayed incidence of decompression sickness with symptoms occurring as late as the sixth hour in a 6-hour decompression.
Bends, the most common symptom, is manifested by pain in the locomotor system. This pain usually begins in the tissue around joints and extends distally along the bone shaft. Pain tends to occur in joints that are being flexed. The pain is deep and poorly localized with periods of waxing and waning. Relief is obtained by relaxation of the part of application of external pressures to the overlaying tissues. Symptoms may spontaneously disappear.
The next most common symptom complex is chokes. Chokes refer to a syndrome of chest pain, cough, and respiratory distress. It usually requires longer altitude exposure than that required for bends. It commences with a burning pain under the breast bone during deep inspiration which is relieved by shallow breathing and gradually becomes more severe and constant. Paroxysms of coughing become more frequent and are followed by cyanosis, anxiety, syncope, and shock.
Figure 5.1.2.2.1.7.1-1 Typical
Time Course of Appearance of New Symptoms of Decompression Sickness in Absence
of Prebreathing
Reference: 11, p. 12-3; NASA-STD-3000 67
Skin lesions, causing itching and a red blotchy rash, usually occur only after prolonged altitude exposure and are associated with, or presage, more serious manifestations of decompression sickness. About 10% of those cases going on to neurocirculatory collapse present previous skin changes. It appears that passage of emboli to the skin is the most probable mechanism.
Cardiovascular symptoms are varied: fainting, low blood pressure, coronary occlusions, heart arrhythmias, and shock have all been seen. Severe and progressive peripheral vascular collapse may develop after one to five hours at altitude. This reaction may, or may not have been preceded by fainting. Signs and symptoms of shock with or without neurological findings are seen. Delirium and coma are more common when neurological findings are present. All fatalities following altitude exposure are preceded by this picture of delayed shock. It usually develops in subjects who have experienced severe chokes, but may be preceded by few or no symptoms. The types of neurologic symptoms run the gamut of almost every acute neurologic disorder. Confusion, visual impairment, and headaches are the most common.
The precise conditions under which a particular individual will develop symptoms of decompression sickness are impossible to predict. In general, for an atmosphere using nitrogen as a diluent, if the supersaturation ratio R = pN2/pB exceeds about 1.22, there will be a risk of decompression sickness. (In the above equation, pN2 is the nitrogen tension in the subject tissue, and pB is the total barometric pressure). For other diluent gases, the critical R value will be different. The tissue tension of the diluent gas at any particular time will depend on the initial and final equilibrium tensions, the solubility of the diluent in the subject tissues, and the rate and duration of decompression. As an example, hyperbaric decompression sickness (DCS) from a normal sea-level atmosphere will occur typically only after decompression below 490 mm Hg (9.5 psia). This onset of DCS pressure will vary some depending on the susceptibility of an individual as influenced by any of the following factors:
a. Body Build - Obesity increases susceptibility to decompression sickness. It is less clear if the percent of body fat within a normal range affects the incidence of decompression sickness.
b. Temperature - Very cold conditions can increase the incidence of decompression sickness significantly.
c. Previous Exposures to Low Pressure - Repeated exposures to hyperbaric conditions may, or may not increase susceptibility to decompression sickness depending on the nature of the exposure. When EVA-type exposures have been repeated over a three-day period, there was no increase in susceptibility.
d. Barometric Compression Prior to Decompression - Any exposure to compressed air breathing occurring less than 24 hours prior to decompression will increase susceptibility.
e. Age - A threefold increase in incidence of decompression sickness has been observed in going from 19 to 25-year old to 40 to 45-year old age groups. In other studies, age has not been a factor for the crewmember population used in these studies.
f. Sex - Valid, conclusive studies are lacking, but it appears that women present a greater risk to decompression sickness than men do.
g. Exercise - Physical exertion can increase the incidence of decompression sickness by up to 40%.
h. Injury - Perfusional changes in an injured area particularly in a joint, may create an increased susceptibility to decompression sickness.
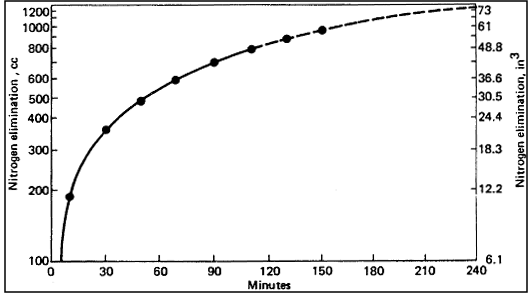
Decompression sickness can be prevented by denitrogenation prior to decompression. This is accomplished by breathing pure oxygen, which reduces alveolar nitrogen pressure and allows nitrogen to come out of the tissues of the body.
Figure 5.1.2.2.1.7.1-2 shows nitrogen eliminated over time while breathing pure oxygen.
Reference: 78, p. 1-292; NASA-STD-3000 68
Ear problems associated with change in barometric pressure are tabulated in Figure
5.1.2.2.1.7.2-1.
Figure 5.1.2.2.1.7.2-1 Type of ear Problems Encountered During Change in Barometric Pressure
| Differential pressure mmHg (psia) |
Symptom |
| 0 (0) |
No
sensation
|
|
3-5
(.06-0.10) |
Feeling
of fullness in ears
|
|
10-15
(0.19-0.29) |
More
fullness, lessened sound intensity
|
|
15-30
(0.19-0.29) |
Fullness,
discomfort, tinnitus in ears: ears pop as air leaves middle ear; desire to
clear ears - if accomplished, symptoms stop
|
|
30-60
(0.58-1.16) |
Increasing
pain, tinnitus, and dizziness and nausea
|
|
60-80
(1.16-1.54) |
Severe
and radiating pain, dizziness and nausea
|
~100
(~1.93) |
Voluntary ear clearing becomes difficult or impossible. |
200+
(3.87+) |
Eardrum ruptures |
Reference: 92, Table 1-3, p. 14;NASA-STD-3000 70
5.1.2.2.1.7.2 Trapped Gas Dysbarism Design Considerations
{A}
If the glottis is held closed during a decompression, or if the air passageway to the lungs is restricted or blocked (e.g., when using an oxygen mask) it is possible for the trapped gas in the alveoli to expand the alveoli past their elastic limit. A differential pressure between the alveoli and the ambient of 50 to 100 mm Hg (1.0 to 2.0 psi) may be sufficient to force gas into extra-alveolar space. Such an accident will likely result in arterial gas embolism, mediastinal and subcutaneous emphysema, and/or pneumothorax.
The effects of gas embolism are similar to those of decompression sickness, but occur immediately in contrast to the delay observed in decompression sickness, and the signs may clear rapidly, leaving a clinical picture similar to stroke.
Mediastinal emphysema, subcutaneous emphysema, and pneumothorax refer to conditions of accumulations of gas in the mediastinal cavity between the pleurae, under the skin, and in the pleurae, respectively.
Typically, equalization of pressure between air pockets in the body and the ambient will take place without conscious effort, except when there is a blockage in the air passages, as discussed above, or if the rate of depressurization is such that equalization cannot take place rapidly enough to produce effects. If this occurs, the most likely injuries will occur to the ear and sinuses, which have the smallest and most easily blocked passages to the ambient.
Occasionally, toothaches are reported due to changes in barometric pressure, usually occurring in teeth that are filled or have cavities, thereby allowing an air bubble to be trapped within.
5.1.2.2.1.7.3 Toxic Gaseous Contaminants Design Considerations
{A}
The effects of carbon monoxide (CO) toxicity and blood levels of carboxyhemoglobin after exposure to different atmospheric concentrations of carbon monoxide are shown in
Figure 5.1.2.2.1.7.3-1. Carbon monoxide is particularly dangerous because it is odorless and colorless and symptoms of toxicity are not readily noticeable. CO is produced by crew metabolism, materials offgassing, and materials thermodegradation or combustion. Normally, the onboard ECLSS ambient temperature catalytic oxidizer (ATCO) does a good job of keeping CO at safe, low levels. CO would be a toxicological concern, however, if the platinum catalyst in the ATCO system were to be poisoned by another chemical or if a fire or smoldering combustion on board produced more carbon monoxide that the ATCO system could handle.
| Atmospheric carbon monoxide, volumes
per million |
Carbon monoxide in blood, % Carboxyhemoglobin |
Effects |
|
0 - 60 |
0-10 |
None subjectively noticeable, but initial visual and psychomotor impairment
is revealed in objective tests. |
| 60 -120 |
10 - 20 |
Tightness across forehead, slight headache, flushed complexion. |
| 120 - 180 |
20 - 30 |
Headache with throbbing in temples, breathlessness from any exertion.
|
| 180 - 240 |
30 - 40 |
Severe headache, weakness, dizziness, dimness of vision, nausea, and
vomiting with possibility of collapse. |
| 240 - 300 |
40 - 50 |
All preceding symptoms with increased pulse rate and respiration and
greater possibility of collapse. |
| 300 - 360 |
50 - 60 |
Loss of consciousness, with increased or irregular respiration, rapid
pulse, and possibility of coma with convulsions. |
| 360 - 480 |
60 - 80 |
Coma, convulsions, depressed heart action, respiratory failure, and possibility
of death. |
Reference: 111, p. 865; NASA-STD-3000 71
Ozone may possibly be produced by electric motors, welding, or ultraviolet light rays in the onboard lighting system. It is especially prone to be produced if there is electric arcing. Exposure to ozone at concentrations of 0.3 to 0.8 ppm causes irritation of the nose and bronchi. Exposure to 0.94 ppm also causes sleepiness and headache. Exposure to 1.5 ppm has been described as intolerable. The lethal concentration in 50% of rats and mice exposed (the LC50) is around 6 ppm. The animals died of shock with edema and hemorrhage in the lungs and bronchi. Higher animals, such as dogs and monkeys, appear to be somewhat more resistant. Persons who have been continuously exposed to ozone develop some tolerance to its effects.
Materials of construction are a source of gaseous contamination due to offgassing to the cabin atmosphere. Offgassing requirements and test procedures are detailed in Reference
24. Compounds for which seven-day maximum allowable concentrations have been established in manned spacecraft are also listed in Reference
24.
5.1.2.3 Atmosphere Monitoring Design Considerations
{A}
5.1.2.3.1 Atmosphere Toxicological Monitoring Design Considerations
{A}
Long tours of duty for crewmembers, closed Environmental Control Life Support Systems (ECLSS), and the possibility for potentially hazardous internal operations make the following three types of analyzers necessary for the toxicological monitoring of spacecraft air during long-duration manned space flights:
a. Regular Monitoring - The continuous generation of contaminants by the offgassing of nonmetallic materials in the vehicle and the potential for chemical spills or leaks necessitate regular monitoring for volatile organics.
b. Compound-Specific Analyzer - Other potential contaminants, such as low volatility organics and inorganics, metals, acid gases, and other gases such as carbon monoxide and nitrous oxide, may require dedicated, compound specific analyzers.
c. Particulate Monitoring - Based on Shuttle program experience, problems with airborne particulate matter can be anticipated and warrant an inflight particulate monitoring capability.
5.1.2.3.2 Atmosphere Microbiological Monitoring Design Considerations
{A}
Epidemiological principles and previous spaceflight studies indicate a high probability of cross-contamination among crewmembers and between crewmembers and space module during long confinements. The ability to monitor, identify, and characterize the microbial flora of the space module is essential due to continual habitation, relatively crowded conditions, and possible altered host/microorganism interactions. The following three design considerations are of particular importance for microbiological monitoring of space module air.
a. Traditionally, ECLSS systems (because of design constraints) have a limited capacity for removing biological agents from the air.
b. The unique properties of microgravity affect the distribution of microbial agents in the space module environment. On Earth, gravity is an important physical force in reducing the presence of aerosols in the air and thus, helps contain the spread of some infectious diseases. While large particles and droplets containing microorganisms are removed from the air in minutes in a 1-G environment, these aerosols may remain suspended indefinitely in microgravity.
c. The immunological status of crewmembers may be compromised due to physiological effects associated with stress and long periods of habitation in a microgravity environment.
5.1.2.3.3 Baro-Thermal Monitoring Design Considerations
{A}
The collection and analysis of atmospheric data (including barometric compositional, and thermal balance information) within the space habitat environmental system are necessary for monitoring human and environmental interactions. The environments to be monitored include those in the habitation modules, the airlocks, and the space suits. This information will be used to characterize the crew's environment relative to the environmental limits established to ensure crew health and safety. The derived information will form a database for analysis of any effect of these controlled environment factors on physiological responses of the crew to the microgravity environment.
The sensors required to monitor the environmental parameters described above are in large components of the cabin and suit environmental control system and in most uses will not require development of separate sensing systems.
5.1.3 Long Term Mission Atmosphere Design Requirements
{A}
Paragraphs 5.1.3.1 through 5.1.3.5 present requirements which are directly applicable to the design of respirable atmospheres for space module cabins for long term missions. These requirements may not be entirely applicable to short term space systems (e.g.; the STS Program or the Spaceplane. Included are atmosphere composition and pressure, monitoring and control of atmospheric parameters, and contaminants and toxicity.
5.1.3.1 Atmosphere Composition and Pressure Design Requirements
{A}
The following design considerations shall apply to the composition and pressure of the space module cabin atmosphere:
a. Internal Environment - An internal environment shall be provided adequate to support and maintain crew comfort, convenience, health, and well being throughout all operational phases in accordance with the requirements given in
Figure 5.1.3.1-1. Concentrations of atmospheric contaminants in habitable areas of the space module shall not exceed the spacecraft maximum allowable concentrations (SMACs) as specified for various exposure periods in
Figure 5.1.3.1-1 Spacecraft Maximum Allowable Concentrations. If no FCSIS SMAC is currently documented for a particular compound of interest, the 7 day SMAC values specified in NHB 8060.1B Appendix D apply. The SMAC values documented in the FCSIS Vol, I, Rev. A, take precedence over the SMAC values listed in NHB 8060.1B. Because ambient pressures on SSMB will be less than 14.7 psi, SMAC values in mg/m3 rather than ppm shall apply.
(Refer to Paragraph 5.8.3.1, Temperature, Humidity, and Ventilation Design Requirements, for other atmosphere related design requirements.)
Figure 5.1.3.1-1 Requirements for Space Module Respirable Atmosphere
(a) Respirable Atmosphere Requirements (Customary units)
| Parameter |
Units |
Operational |
90-day degraded (1) |
28-day emergency |
|---|
| CO2 partial press
|
mmHg |
3.0 max |
7.6 max |
12 max |
| Temperature (7)
|
deg. F |
65 - 80 |
65 - 80 |
60-85 |
|
Dew point (2)
|
deg. F |
40 - 60 |
35 - 70 |
35-70 |
|
Ventilation
|
ft/min |
15 - 40 |
10 -100 |
10-200 |
|
O2 partial pressure (3)
|
psia |
2.83 - 3.35 |
2.4 - 3.45 |
2.3 - 3.45 |
|
Total pressure
|
psia |
14.5 - 14.9 |
14.5 - 14.9 |
14.5 - 14.9 |
|
Diluent gas
|
|
N2 |
N2 |
N2 |
|
Trace contaminants (6)
|
ppm |
TBD |
TBD |
TBD |
|
Micro-organisms
|
CFU/m3 (4) |
500 (5) |
750 (5) |
1000 (5) |
| Particulates > 0.5 micron |
counts/ft3 |
100,000 max |
TBD |
TBD |
(b) Respirable Atmosphere Requirements (Sl Units)
Parameter
|
Units
|
Operational
|
90-day degraded (1)
|
28-day emergency
|
|---|
|
CO2 partial press
|
N/m2 |
400 max |
1013 max |
1600 max |
|
Temperature (7)
|
deg. K |
291.5-299.9 |
288.8-302.6 |
288.8-305.4 |
|
Dew point (2)
|
deg. K |
277.6-288.7 |
273.9-294.3 |
273.9-294.3 |
|
Ventilation
|
m/sec |
.076-203 |
.051-508 |
.050-1.016 |
|
O2 partial pressure (3)
|
kP2 |
19.5-23.1 |
16.5-23.8 |
15.9 -23.8 |
|
Total pressure
|
kP2 |
100-101.4 |
100-101.4 |
100-101.4 |
|
Diluent gas
|
|
N2 |
N2 |
N2 |
|
Trace contaminants (6)
|
mg/m3 |
TBD |
TBD |
TBD |
|
Micro-organisms
|
CFU/m3 (4) |
500 (5) |
750 (5) |
1000 (5) |
|
Particulates > 0.5 micron
|
counts/m3 |
3,530,000 max
|
TBD
|
TBD
|
Notes:
(1) Degraded levels meet fail operational criteria.
(2) Relative humidity shall not exceed 70% in the operational mode or 75% in the degraded mode or 75% in the degraded or emergency mode and shall not be less than 25%.
(3) In no case shall the O2 partial pressure below 15.9 kP2 (2.3psia) or the O2 concentration exceed 23.8 percent of the total pressure at 14.7 psia.
(4) CFU - Colony Forming Units.
(5) These values reflect a limited base. No widely sanctioned standards are available.
(6) Will be based on NHB 8060.1B, (J8400003).
(7) In the operational mode temperature will be selectable to 1.1 °C ( 2
°F) throughout the range.
Reference: 37, Figure 20101-A, B;
92, pp. 2, 42, 55; 111,
p. 863; 198, p. 27; 264, Table 11.2, Paragraph 11.1.1/4;
268, p. 5; 278
p. 321, Table 2.4-1; 323, Table C-4-lX,
p. C-4-45; 324, Table 2-9; NASA-STD-3000 72
b. Atmospheric Revitalization - An atmospheric revitalization system shall continuously regenerate the module atmosphere as required to provide a safe and habitable environment for the crew. This system will be referred to as the Environmental Control Life Support System (ECLSS).
c. Atmosphere Control and Supply:
1. Atmospheric pressure and composition control functions shall provide a method of regulating and monitoring the total pressure and the major constituent partial pressures of gases in the module atmospheres.
2. The total pressure of the module shall be maintained at the pressure levels defined in
Figure 5.1.3.1-1.
3. The controls shall be provided and shall be operable by a crewmember in a shirt sleeve environment or by a remote operator. For specific requirements for pressure suit operations for repressurization see
Paragraph 9.2.3.2.1 b.
4. Normally, the controls shall operate autonomously with limited or no crew intervention necessary.
d. ECLSS Design Requirements :
1. The systems of the ECLSS will provide atmospheric pressure and composition control, module temperature and humidity control, atmospheric revitalization, water management, EVA support, and fire and contamination monitoring and control.
2. The ECLSS shall accommodate whatever phased evolutionary growth is anticipated for the space module.
3. The ECLSS shall embody regenerative concepts to minimize the use of expendables.
e. Hyperbaric Treatment - Where altitude decompression sickness may occur as a result of operational activity or contingency operation, access to a hyperbaric treatment facility is required.
5.1.3.2 Atmosphere Monitoring Design Requirements
{A}
Atmospheric monitoring instruments shall require as little crew time as possible for operation and maintenance .
5.1.3.3 Atmosphere Toxicology Monitoring Design Requirements
{A}
Design requirements for monitoring of volatile organics, airborne particulate matter, and compound-specific monitoring are as follows:
a. Monitoring Volatile Organics - The monitoring of volatile organics shall be accomplished.
1. Total hydrocarbon analyzers shall be used to monitor the overall organic concentration in the air of all habitable areas. These analyzers shall provide real time indication of total organic contamination in the air. These monitors shall be equipped with audible and visible alarms to alert crewmembers when contaminant concentrations exceed maximum acceptable levels.
2. An additional monitor shall be available to identify and quantify target organic compounds and take measurements at regularly scheduled intervals.
b. Compound-Specific Monitoring :
1. Compound specific monitors shall be located near equipment, chemical operations, and processing activities which are potential sources of chemical contamination of the space module. These monitors shall be used to monitor for specific chemical contaminants in the air. These analyzers shall have continuous real-time monitoring capabilities.
2. These monitors shall be equipped with audible and visible alarms to alert crewmembers when concentrations exceed maximum acceptable levels.
c. Particle Monitor - A monitor shall be provided to determine nonspecific particulate loading in the air on a real-time basis. Respirable particles in the 0.5-100 micron range per unit volume of air shall be measured.
5.1.3.4 Atmosphere Microbiological Monitoring & Control Design Considerations
{A}
The microbiological monitoring and control design considerations are as follows.
a. Limits - The limits given in Figure 5.1.3.4-1 shall be observed.
Figure 5.1.3.4-1 Atmosphere Microbiological Limits and Monitoring Requirements
| Sample source |
Monitoring Requirements |
Postflight |
Acceptability Limit |
| Preflight |
Inflight |
| Air |
Prior to closeout |
Weekly intervals and within 12 hrs of crew exchange |
- |
Levels of airborne microorganisms may not exceed 500 CFU per cubic meter |
| Notes: CFU - Colony forming units |
Reference: 278, Figure C-2-6; NASA-STD-3000 73 with Updates
b. Air Sampler - Monitoring of the air will be conducted. An air sampler shall monitor air throughout the habitable areas of the facility. It shall be capable of monitoring for the presence of bacteria, yeast and molds.
5.1.3.4.1 Microbial Decontamination Design Requirements
{A}
Decontamination is required when acceptability limits are exceeded or sensory factors indicate microbial contamination has occurred. Decontamination procedures, antimicrobial agents, and supporting equipment shall be provided to counteract and control all contamination events.
5.1.3.4.2 Verification Design Requirements
{A}
Following decontamination measures, the previously contaminated entity shall be re-tested and verified to be within acceptability limits.
5.1.3.4.3 Cross Contamination Design Requirements
{A}
The following cross contamination design considerations shall apply:
a. Bioisolation Facilities - All procedures involving the maintenance and experimentation activities of biological specimens will be conducted in bioisolation facilities that prevent microbial (bacteria, fungi, and parasites) cross- contamination between crewmembers and biological specimens.
b. Pathogen Free Animals - All experimental animals to be utilized aboard the space module shall meet the specific pathogen free criteria established for the applicable project.
5.1.3.5 Baro-Thermal Monitoring Design Requirements
{A}
To insure that all environmental control systems are functioning properly, the Environmental Monitoring System shall monitor and record atmospheric parameters from each habitable element.
5.2 MICROGRAVITY
{O}
5.2.1 Introduction
{O}
This section provides a short description of the design considerations for the microgravity environment. The physiological effects of microgravity are stressed. More detailed data related to microgravity are found in
Paragraph 3.3.4, Neutral Body Posture;
Section 4.0, Human Performance Capabilities; Paragraph
5.3, Acceleration; Section 8.0, Architecture;
Section 9.0, Workstations; and Section
11.0, Hardware and Equipment.
The term microgravity denotes the acceleration regime commonly referred to as weightlessness, zero gravity, or null gravity. It is almost impossible to achieve a pure zero-g environment due to the orbital mechanics. The only place on a spacecraft (in a stable orbit) that is at zero-g is at the spacecraft's center of mass.
For the purposes of man-system integration, any acceleration level below 1E-4 G's is, for all practical purposes, zero-gravity, or weightlessness, or microgravity. The physiological and performance effects are the same at any acceleration level at, or below, this approximate g-level.
5.2.2 Microgravity and Its Counterparts Design Considerations
{O}
This section addresses the physiological effects and the changes in eating, sleeping, and mobility design considerations associated with the microgravity environment.
5.2.2.1 Physiological Effects of Microgravity
{O}
This section addresses some of the physiological effects of microgravity. There is much more detail available on each of the selected topics that can be found in the references cited for this paragraph (refer to
Appendix B in Volume 2).
Duration of microgravity exposure is a major factor in determining the detrimental effects described below. The longest US mission to date was the Skylab 4 mission of 84 days. There is a significant body of literature on the biomedical effects observed on this and the other Skylab missions. The Soviets have had crewmembers on orbit for a maximum of over 300 days. The biomedical data from these long- duration Soviet missions have not been widely published.
In general, it takes the body about three days to adjust to the microgravity environment. Most crewmembers become accustomed to working and living in space within a few hours and their performance improves throughout the mission. Most of the adverse biomedical effects are reversed within a matter of hours to
weeks following return to Earth.
a. Calcium Loss - One of the biggest concerns during long-term microgravity exposure is the calcium loss from the bones. During the Skylab missions, this loss was not excessive. The Soviets indicate that the rate of calcium loss slows after four or five months. Calcium loss (which is similar to osteoporosis and is referred to as bone mass loss or bone demineralization) will limit the length of time crewmembers can remain in microgravity. At this time dietary mineral supplements are not known to be effective in preventing bone mass loss.
b. Fluid Shifts, Skeletal Changes, and Muscle Mass Loss - Other physiological effects are due to fluid shifts and decompression of the spine. The muscle mass of the lower body and, in particular the calves, becomes smaller due to disuse atrophy. Exercise can help reduce this tendency.
The body length increases due to spinal lengthening and straightening. The discs between the vertebrae expand (similar to what happens when sleeping) but do not recompress because of the lack of gravitational compression forces. There is also an upward shift of the internal organs causing a reduced waist measurement. These considerations should be taken into account when sizing space clothing.
There is a microgravity neutral body posture that results from a balancing of muscular forces acting on the various body joints in the weightless environment (see
Figure 3.3.4.3-1). This neutral body posture causes some peculiar performance effects. For example, it is difficult to work at waist level as is done on Earth as the arms must be continually forced down to the waist level to do work at the table top level. It is also difficult to bend forward as this requires significant effort by the abdominal muscles. It is difficult to stand erect or sit in an upright (1-G) manner. Putting on shoes and socks becomes a significant chore if tried to be done as it is on Earth.
Fluid shifts occur that redistribute body fluids toward the upper body. This is due to the lack of gravity effects that normally distribute the fluids toward the lower body. The most visible effect of fluid shift is seen in the face and neck. The face becomes swollen and the veins in the forehead and neck appear distended.
c. Vestibular Alterations - Another system adversely affected by the microgravity environment is the vestibular complex. Two categories of vestibular side effects result from microgravity. One category includes a variety of vestibular reflex phenomena such as postural and movement illusions, vertigo, and dizziness. The second category is space motion sickness. These two categories of response are believed to be closely tied; motion sickness often follows vertigo and postural illusions. There is evidence to suggest that as vestibular reflex phenomena disappear with adaptation, the rise of motion sickness subsides.
Conflicting stimulation of the visual, vestibular, and proprioceptive systems can produce deficiencies in sensory-motor coordination, including control of posture.
Space motion sickness exhibits symptoms resembling Earth motion sickness. These symptoms range from stomach awareness and nausea to repeated vomiting. Symptoms also include pallor and sweating.
Space sickness has been a recurring problem in the history of manned space flight. While this syndrome appears to decline within three to five days, in some cases, the degree of illness has hindered work capacity and disrupted the scheduling of important mission activities. Nine of the 25 Apollo astronauts suffered some degree of sickness, while five of the nine Skylab crewmembers experienced symptoms. Soviet cosmonauts have reported similar experiences. There were suggestions that the 1971 Soyuz 10 flight may have been prematurely ended due to space motion sickness.
Errors in interpreting the visual environment can occur during space motion sickness. Errors in the perception of lights are common. Fatigue may cause a loss of binocular vision. Movement illusions are marked by perceived rotation or by changes in perceived linear acceleration.
(Refer to Paragraph 4.5, Vestibular System, for detailed discussion of the effects of microgravity on the vestibular system; this includes more information on space motion sickness.)
(Refer to Paragraph 4.6, Kinesthesia, for a discussion of the effects of microgravity on kinesthesia.)
(Refer to Paragraph 4.8, Motor Skills, for a discussion of the effects of microgravity on coordination.)
5.2.2.2 Sleeping, Eating, and Mobility Changes in Microgravity
{O}
In the microgravity environment, sleeping, eating and mobility are all affected in some measure.
a. Sleep - It is difficult to isolate weightlessness as a factor influencing the quality of sleep. Sleep disturbances have been common during space flight, but these appear to be much more profoundly affected by operational factors (thruster firings, fan noise, crew mobility) than by the microgravity environment alone. (Refer to
Paragraph 7.2.4, Sleep, for more detailed discussion.)
b. Eating in Weightlessness - Space diets have consisted of freeze-dehydrated, intermediate moisture, thermo stabilized, and limited irradiated food. The freeze-dehydrated food is reconstituted inflight with either hot or cold water. Drinks and snacks are also provided. Initially, these foods were eaten through tubes incorporated into the food container, but it has been found that eating foods can be accomplished using conventional utensils. As food technology has improved, the food and food service utensils have approached the traditional practices on Earth.
(Refer to Paragraph 7.2.2, Nutrition, for details on nutrition.)
(Refer to Paragraph 10.5, Galley and Wardroom, for galley design considerations and requirements.)
c. Mobility - The absence of gravity has been found to be a bonus for locomotion in space. Once accustomed to movement in microgravity, mobility is accomplished with minimal effort. Acrobatic maneuvers, such as rolling, tumbling, and spinning, are done with ease.
(Refer to Paragraph 11.8 Mobility Aids, for mobility design considerations and requirements.)
5.2.3 Microgravity Design Requirements
{O}
The microgravity design requirements are given in other paragraphs where the applicable acceleration regime has been coded {O} (O = orbital). Refer to
Appendix G in Volume 2 for a complete listing of all paragraph's acceleration regime
applicabilities.
(Refer to Paragraph
1.4.3.3, Acceleration Regime Applicability, for an explanation of the acceleration regime coding used in this document.)
5.3 ACCELERATION
{A}
5.3.1 Introduction
{A}
This section addresses the design considerations and requirements for linear, rotational, and impact accelerations.
The documents and database include a coding for each paragraph that designates which acceleration
regime(s) are applicable to the data.
(Refer to Paragraph
1.4.3.3, Acceleration Regimes Applicability, for an explanation of this coding.)
Figure 5.3.1-1 shows the coordinate system nomenclature that is used in this document. This system is based on the direction a body organ (e.g., the heart) would be displaced by acceleration. Table II in this figure (and in particular, system 4, which is based on displacement of body fluids) explains the most commonly employed terms.
Figure 5.3.1-1 Acceleration Environment Coordinate System Used in NASA-STD-3000
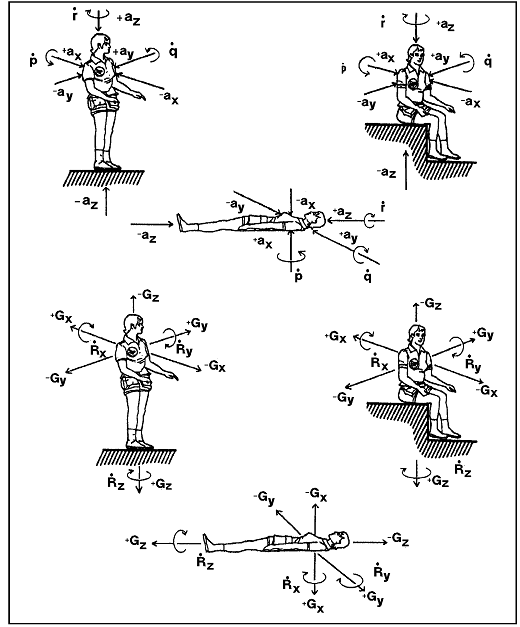
Reference: 101, p. 9; NASA-STD-3000 436
Figure 5.3.1-1 Acceleration Environment Coordinate System Used in NASA-STD-3000 (cont)
| LINEAR MOTION |
Direction of Acceleration
|
Inertial Resultant of Body
Acceleration
|
| Acting Force |
Acceleration Description |
Reaction Force |
Verticular Description |
| Forward |
+ax |
Forward accel. |
+Gx |
Eye Balls In |
| Backward |
-ax
|
Backward accel. |
-Gx
|
Eye Balls Out
|
| Upward |
-az |
Headward accel. |
-Gz |
Eye Balls Down
|
| Downward |
+az |
Foorward accel. |
+Gz |
Eye Balls Up
|
| To Right |
+ay |
R. Lateral accel. |
+Gy |
Eye Balls Left |
| To Left |
-ay |
L. Lateral accel.
|
-Gy |
Eye Balls Right
|
| ANGULAR MOTION |
| Roll Right |
+p |
|
-Rx |
Cartwheel |
| Roll Left |
-p |
|
+Rx
|
|
| Pitch Up |
+q |
|
-Ry |
Somersault |
| Pitch Down |
-q |
|
+Ry |
|
| Yaw Right |
+r |
|
+Rz |
Pirouette |
| Yaw Left |
-r |
|
-Rz |
|
| Footnotes: Large letter, G, used as unit to express inertial resultant
to whole body acceleration in multiples of the magnitude of the acceleration of
gravity. Acceleration of gravity, go, = 980,665 cm/sec2
or 32.1739 ft/sec2.
|
Reference: 380 With Updates; NASA-STD-3000 435 
(Refer to Paragraph 5.5, Vibrations, for the related acceleration environment of vibrations.)
(Refer to Paragraph 4.5, Vestibular System, for a description of the human vestibular system that is pertinent to discussion of acceleration environments.)
(Refer to Paragraph 5.2, Microgravity, for the special considerations and requirements for the microgravity environment.)
5.3.2 Acceleration Design Considerations
{A}
This section describes the acceleration environments and the human responses to these environments.
5.3.2.1 Acceleration Environments
{A}
This section contains the descriptions of the linear, rotational, and impact acceleration environments that can be encountered during space vehicle operations of launch, on-orbit,
transorbit, planetary, entry, and aborts.
5.3.2.1.1 Linear Acceleration Environments
{A}
For space systems, sustained linear acceleration environments include the following:
a. Low Accelerations Experienced in Transorbital Flight - Approximately 10-6 to 10-3 G's
(omnidirectional)
b. Low G-Levels Found on the Moon and Mars - Approximately 0.17 to 0.4 G's.
c. 1-G Level On Earth.
d. Multi-g's Experienced During Launch, Entry, and Abort Operations:
1. Approximately 1 to 6 +Gx during launch and entry (pre-Shuttle).
2. Approximately 1 to 2 +Gx during stage separation.
(Space Shuttle range is 1 to 3 +Gx during launch with a 4+Gx spike at booster ignition and 1/2
+Gx during separation maneuvers.)
5.3.2.1.2 Rotational Acceleration Environments
{A}
In the space environments, rotational accelerations are encountered during one of the following flight events:
a. Orbital Maneuvers - Approximately ± 0.8 to ± 1.46 deg/sec2 (omnidirectional).
b. Launch/Entry/Abort Maneuvers - Approximately ± 10 deg/sec2 (omnidirectional).
5.3.2.1.3 Impact Acceleration Environments
{A}
Impact accelerations are abrupt onset, short duration, high magnitude acceleration/deceleration events. It is generally considered that impact involves the occurrence of forces of less than one second duration. Some impact conditions to which space crewmembers may be exposed include: thruster firing, ejection seat/ejection capsule firings, escape device deployment, flight instability, air turbulence, and crash landings:
Aircraft ejection seat firings - up to 17 +Gz
Crash landings - from 10 to greater than 100 G's (omnidirectional)
Orbiter crew compartment design loads for crash landings are 20 Gx and 10 +Gz.
Violent maneuvers - approx. 2-6 G's (omnidirectional).
Parachute opening shock - approx. 10 +Gz.
5.3.2.2 Human Responses to Linear Acceleration
{A}
This section describes the human responses to linear accelerations. This includes the factors that affect human tolerance to linear accelerations and the general and specific human responses.
5.3.2.2.1 Factors Affecting Human Acceleration Tolerance
{A}
Linear acceleration tolerance depends on many factors. The following is a brief summary:
a. Magnitude of the applied force.
b. Duration of the applied force.
c. Rate of onset and decline of the applied force.
d. Direction of the g vector.
e. Types of g-protection devices and body restraints.
f. The coupling between the crewmember and the vehicle via seats, couches, etc.
g. Body positioning, including the specific back, head and leg angles.
h. Environmental conditions such as temperature and lighting.
i. Age of the crewmember.
j. Emotional/motivational factors such as competitive attitude, fear, anxiety, self-confidence, confidence in equipment, and willingness to tolerate discomfort and pain.
k. Previous acceleration training, techniques of breathing, straining, and muscular control.
l. Human Physical condition.
m. Extent of Microgravity Adaptation and Body Fluid Shift.
n. Dietary Habits, particularly with respect to the quantities of Fruits, Fibers, and Fluids ingested.
5.3.2.2.2 Subjective Effects of Linear Accelerations
{A}
The following is a summary description of the combined human responses to specific linear acceleration vectors and magnitudes.
In operational situations it is unusual, if not impossible, for acceleration to remain precisely constant. Accelerations may be accompanied by complex oscillations and vibrations. For purposes of the following discussion, it is simpler to consider the response to sustained linear accelerations in one direction:
a. Upward Acceleration Effects ( + Gz) (In Seated Posture)
1 Gz
Equivalent to the erect or seated terrestrial posture
2 Gz
Increased weight; increased pressure on buttocks; drooping of face and body tissue
2 1/2 Gz
Difficult to raise oneself
3 - 4 Gz
Impossible to raise oneself; difficult to raise arms and legs; movement at right angles impossible; progressive dimming of vision after 3-4 seconds; progressive tunneling of vision
4 1/2 - 6 Gz
Diminution of vision; progressive blackout after about 5 seconds; hearing and then consciousness lost if exposure continued; mild to severe convulsions in about 50% of the subjects during or following unconsciousness, frequently with bizarre dreams; occasionally paresthesias, confused states, and rarely, gustatory sensations; no incontinence; pain not common, but tension and congestion of lower limbs with cramps and tingling; inspiration difficult; loss of orientation of time and space for up to 15 seconds post-acceleration
b. Downward Acceleration Effects (- Gz)
-Gz - Unpleasant, but tolerable, facial suffusion and congestion
-2 to -3 Gz - Severe facial congestion; throbbing headache; ori-gressive blurring, , or graying, or occasionally reddening of vision after 5 seconds; congestion disappears slowly; may leave petechial hemorrhages, edematous eye-lids
-5 Gz - Five seconds is limit of tolerance rarely reached by most subjects
c. Forward Acceleration Effects ( + Gx)
2 - 3 Gx - Increased weight and abdominal pressure; progressive slight difficulty in focusing and slight spatial disorientation, each subsiding with experience; 2 Gx tolerable for at least 24 hours; 4 Gx tolerable up to at least 60 minutes - 3 - 6 Gx
Progressive tightness in chest, chest pain; loss of peripheral vision; difficulty in breathing and speaking; blurring of vision, effort required to maintain focus
6 - 9 Gx
Increased chest pain and pressure; breathing difficult, shallow respiration from position of nearly full inspiration; further reduction in peripheral vision, increased blurring, occasional tunneling, great concentration required to maintain focus; occasional lacrimation; body, legs, and arms cannot be lifted at 8 Gx; head cannot be lifted at 9 Gx
9 - 12 Gx
Breathing difficulty severe, increased chest pain, marked fatigue, loss of peripheral vision, diminution of central acuity, lacrimation
15 Gx
Extreme difficulty in breathing and speaking, severe viselike chest pain; loss of tactile sensation, recurrent complete loss of vision
d. Backward Acceleration Effects ( - Gx)
Similar to those of + Gx acceleration with modifications produced by reversal of the force vector. Chest pressure reversed, hence, breathing is easier; pain and discomfort from outward pressure toward restraint harness manifest at 8-Gx; forward head tilt cerebral hemodynamic effects akin to Gz; feeling of insecurity from pressure against restraint
e. Lateral Acceleration (± Gy) Little information available
± 3 Gy
Discomfort after 10 seconds; pressure on restraint system; feeling of supporting entire weight on clavicle; inertial movement of hips and legs; yawing and rotation of head toward shoulder; petechiae and bruising; engorgement of dependent elbow with pain
± 5 Gy
14.5 seconds leads to external hemorrhage; severe headache after exposure
5.3.2.2.3 Specific Effects of Linear Accelerations
{A}
There is a large amount of data that describes the effects of accelerations on specific body systems. Refer to the references cited in
Figure 5.3.2.2.3-1 for detailed discussions.
Figure 5.3.2.2.3-1 Sources of Data for Specific Physiological Effects of Linear Acceleration
| Specific physiological effects |
Reference number |
Page number |
|
a. Posture changes (also refer to
Paragraph 3.3.1)
|
92 |
49-154 |
| b. Mobility changes (also refer to
Paragraph 3.3.2) |
10 |
7-48 |
|
c. Vision changes (also refer to
Paragraph 4.2) |
36 |
525-527 |
| 92 |
155-160 |
| d. Grayout and blackout |
36 |
525 |
| 92 |
152 |
| e. Reaction time (also refer to
Paragraph 4.7) |
36 |
525 |
| f. Cardiovascular work |
92 |
154, 373-379 |
| 7 |
18 |
| g. Vestibular effects (also refer to
Paragraph 4.5) |
10 |
7-64 to 7-95 |
| 86 |
35-45 |
| 92 |
387-389 |
| h. Gas exchange |
7 |
154, 373-389 |
| 92 |
35-45, 387-389 |
| I. Fluid pooling |
7 |
17 |
| j. Motion sickness |
86 |
36-37 |
| 92 |
553 |
NASA-STD-3000-48
5.3.2.3 Human Responses to Rotational Accelerations
{A}
Tolerance to rotational accelerations depends on the interaction of at least three factors: 1) center of rotation with respect to the body, 2) axis of rotation, and 3) the rotation rate.
Most subjects, without prior experience, can tolerate rotation rates up to 6 rpm in any axis or combination of axes.
Most subjects cannot initially tolerate rotation rates in the region of 12 to 30 rpm and rapidly become sick and disoriented above 6 rpm unless carefully prepared by a graduated program of exposure.
Rotation rates of 60 rpm for up to 3 or 4 minutes around the pitch axis (y-axis) and around the yaw axis (z-axis) have been described by subjects as being not only tolerable but pleasant.
Rotational rates at about 80 rpm in the pitch mode and at about 90-100 rpm in the yaw mode are intolerable.
In the pitch axis, with the center of rotation at the heart level, symptoms of backward acceleration ( - Gx) are demonstrated at about 80 rpm and are tolerable for only a few seconds. Some effects of forward acceleration (+ Gx), namely numbness and pressure in the legs, are also observed but develop slowly, with pain being evident at about 90 rpm. No confusion or loss of consciousness is found, but in some subjects disorientation, headache, nausea, or mental depression are noted for several minutes after a few minutes of exposure.
With rotation in the yaw mode, when the head and trunk are inclined forward out of the z-axis, rotation becomes close to limiting at 60 rpm for 4 minutes, although, some motivated subjects have endured 90 rpm in the same mode. Except for unduly susceptible subjects, tolerance tends to improve with exposure.
Long-duration runs in the pitch mode have been endured up to about 60 minutes at 6 rpm in selected subjects.
Unconsciousness from circulatory effects alone occur after 3 to 10 seconds in the pitch mode at 160 rpm with the center of rotation at the heart and at 180 rpm with the center of rotation at the iliac crest.
Severe disorientation and performance degradation have been experienced by air and space crewmembers during random tumbles. Serious problems persist through the period of tumbling causing disorientation, reach and manipulative performance degradation ultimately interfering with the ability to make corrective actions.
It has been recommended that if rotation is used to create artificial gravity, the following general principles should be observed to minimize the effects of rotational acceleration on the human:
a. Radial traffic should be kept to a minimum.
b. The crewmembers should not traverse through the spin axis unless the hub is nonrotating.
c. The living and working areas should be located as far as possible from the axis of rotation.
d. The compartments should be oriented so that the primary traffic paths are parallel to the vehicle spin axis.
e. Workstation positions should be oriented so that, during normal activity, the lateral axis through the crewmember's ears is parallel to the spin axis. In conjunction with this, the controls and displays should be designed so that left/right heat rotations and up/down arm motions are minimized.
5.3.2.4 Human Responses to Impact Accelerations
{A}
Tolerance to impact and shock is usually based upon skeletal fracture levels. Damage to the vertebrae is most common. At higher levels of impact, injury to the head is the most frequent and severe manifestation.
There are two main factors which, when combined with the amplitude of acceleration, determine tolerance. These are 1) the time function, i.e., the total time of acceleration exposure and 2) the orientation of the subjects with respect to the direction of acceleration, primarily the relationship between the longitudinal (spinal) axis and the acceleration vector. For linear impact accelerations, those applied at right angles to the spinal axis are better tolerated than those applied parallel to this axis.
Figure 5.3.2.4-1 shows impact survival experience. It should be noted that numerous biophysical factors influence survival, so the approximate survival limit shown is only an estimate.
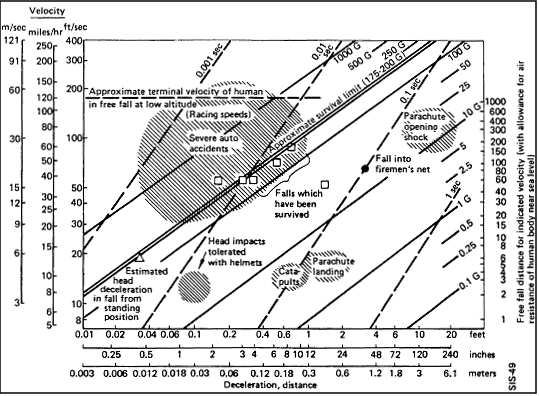
Reference: 92, Figure 6-3, p. 228; 407;
408; 409;
417; NASA-STD-3000 49
5.3.3 Acceleration Design Requirements
{A}
5.3.3.1 Linear Acceleration Design Requirements
{A}
The following linear acceleration design requirements shall be observed:
a. Linear Acceleration Limits for Unconditioned and Suitably Restrained Crewmembers - The accelerations in any vector shall not exceed those magnitudes and durations specified in
Figure 5.3.3.1-1.
b. Linear Acceleration Limits for Preconditioned and Suitably Restrained Crewmembers - Accelerations shall not exceed those magnitudes and durations specified in
Figure 5.3.3.1-2.
(Refer to Paragraph 11.7.2.3.3.2, Body Restraint Loads, for seat belt and shoulder harness design loads.)
Figure 5.3.3.1-1 Linear Acceleration Limits for Unconditioned and Suitably Restrained Crewmembers
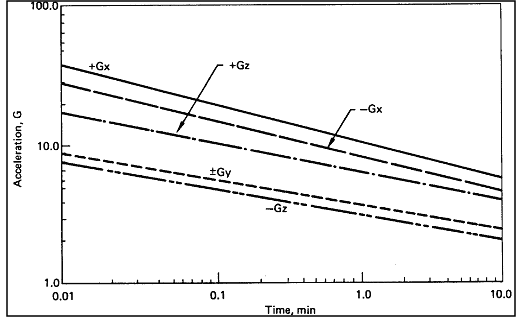
Reference: 198, p. 13; 415;
418; NASA-STD-3000 50
Figure 5.3.3.1-2 Linear Acceleration Limits for Pre-Conditioned and Suitably Restrained Crewmembers
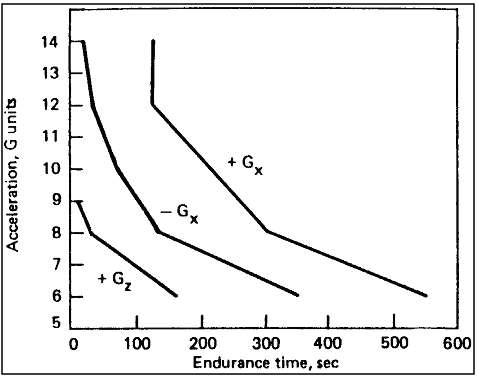
Reference: 78, p. 1-164; NASA-STD-3000 51
5.3.3.1.1 Entry Acceleration Design Requirements
{A}
The emergency vehicle shall be capable of limiting sustained entry acceleration to be no greater than 4G's in the ± Gx direction, 1 G in the ± Gy direction, and 0.5 G's in the ± Gz direction.
5.3.3.2 Rotational Acceleration Design Requirements
{A}
The following rotational acceleration design requirements for rotation about the pitch axis shall be observed:
a. Rotational Acceleration Limits With Center of Rotation at the Heart - Accelerations shall not exceed the limits specified in
Figure 5.3.3.2-1.
b. Rotational Acceleration Limits with a G Field Decaying from 35 to 15 G's - Accelerations shall not exceed the limits specified in
Figure 5.3.3.2-2.
Figure 5.3.3.2-1 Rotational Acceleration Limits for Rotation About the Pitch Axis With No superimposed Deceleration Field With Center of Rotation at the Heart
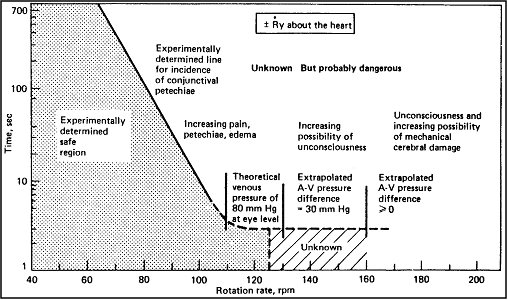
Reference: 78, p. 1-187; NASA-STD-3000 62
Figure 5.3.3.2-2 Rotational Acceleration Limits for Rotation About the Pitch Axis With No superimposed Deceleration Field With Center of Rotation at the Heart
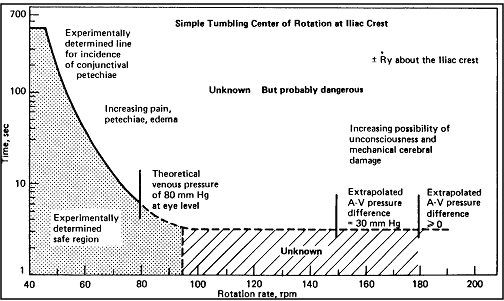
Reference: 78, Fig. 9, p. 1-187; NASA-STD-3000 53
5.3.3.3 Impact Acceleration Design Requirements
{A}
Impact accelerations are those that occur over times of less than one second. Impact acceleration limits are as follows:
a. Impact Acceleration Limits - Impact forces shall not exceed those shown in
Figure 5.3.3.3-1.
Figure 5.3.3.3-1 Impact Acceleration Design Limits
Duration of force < one second
|
Direction of Impact acceleration
|
Impact limit
|
Rate of impact
|
|---|
|
±Gx
|
20 G
|
1,000 G/sec
|
| ±Gy |
20 G |
1,000 G/sec |
| ±Gz |
15 G |
500 G/sec |
| 45 deg off-axis (any axis) |
20 G |
1,000 G/sec |
Reference: 198, p. 18; NASA-STD-3000 54
5.4 ACOUSTICS
{A}
5.4.1 Introduction
{A}
Acoustics is the science and technology of sound, including its production, transmission, and effects. Sound is generally used to refer to any vibration or passage of zones of compression and rarefaction through the air or any other physical medium which is sufficient to stimulate an auditory sensation. The primary concern here is with sound that arrives at the crewmember's ear via an airborne path.
This section establishes the appropriate noise level for manned spacecraft. Acoustic design requirements include general design goals, and noise exposure limits for working and living areas. Examples of typical acoustic design solutions are included. This section also discusses the potential sources of noise, propagation paths to the receiver, and human response to noise.
(Refer to Paragraph 4.3, Auditory System, for related information.)
5.4.2 Acoustics Design Considerations
{A}
The acoustical design goals are to establish a satisfactory environment relative to the human response to noise, to prevent hearing loss, to minimize disruption of speech communications, and to minimize noise-induced annoyance/stress factors.
Launch/entry noise is categorized as short-term noise exposure. Orbiting (and flight) phase spacecraft noise limits are in the category of long-term exposure, where duration of exposure is a very important consideration.
Acoustic noises are pressure fluctuations in the atmosphere, measured with instruments displaying sound pressure levels in logarithmic units known as decibels (dB). The ear perceives sound pressure amplitudes with logarithmic sensitivity; therefore, it is more convenient to express sound pressure in terms of decibels.
The threshold of hearing in the frequency range of 1000 to 5000 Hz is about 20 µPascals (2.9 × 10⁻⁹ psi). The ear experiences pain when the sound pressure reaches about 200 Pascals (0.029 psi). The ratio of sound pressure between thresholds of hearing and pain at the ear is about 107. Sound pressure level in dB is a ratio between any two sound pressures where one sound pressure is a reference sound pressure, usually the threshold of hearing (20 uPascals). The definition of sound pressure level (SPL) is:
where P is the root-mean-square sound pressure in Pascals for the sound in question, and Po is the reference sound pressure is 20 × 10-6 Pascals. The dynamic range of hearing is therefore:
Figure 5.4.2-1 shows the relationship of sound pressure level in decibels to sound pressure in Pascals. Some approximate SPLs for certain sounds and noises are indicated.
Figure 5.4.2-1 Sound Pressure Level (dB) as a Function of Pascals and PSI
| Sound pressure level
(SPL) in decibels (dB) |
SPL in Pascals |
(psi) |
|
198 |
|
|
|
194
192
186
180
|
100,000
|
(14.7)
|
| Some military guns |
174
168
162
156
|
10,000 |
(1.47) |
| |
150
144
138
|
1,000
|
(147,000µ) |
| Sonic booms |
132
126
120
|
100 |
(14,700µ) |
| Threshold discomfort, 1000 Hz tone, steady state |
114 |
10 |
(1470µ) |
| |
108
102
|
|
|
| 1500 ft. from commercial jet aircraft |
96
90 |
1 |
(147µ) |
| |
84
78
|
|
|
| 50ft. from auto, 35 mph |
74
72
|
0.1 |
(14.7µ) |
| Speech in noise, 1 meter from talker |
66
60
|
|
|
| Speech in quiet, 1 meter from talker |
54
48
42
|
0.01 |
(1.47µ)
|
| |
36
30
24
|
0.001 |
(0.147µ) |
| Audiometer threshold, 1000 Hz |
18
12
6
|
100µ |
(0.0147µ) |
| Open ear threshold, 1000 Hz tone |
0 |
20µ |
(0.0029µ) |
| Open ear threshold, 4000 Hz tone |
-6
-12
|
10µ |
(0.00147µ) |
|
Notes:
1. Sound pressure level in decibels (dB) 20 log 10(P/20mPa)
2. Normal atmosphere is (0 deg C sea level) 1 bar = 14.7lbs./in2 = 2117
lbs/ft2 = 105 Pascals =106 Pascals = 106
dynes/cm2 = 194 dB re 20m Pa = 105 Newtons/m2
3. Every doubling of the sound pressure causes an increase of 6 dB
4. A 1.41 increase in sound pressure causes an increase of 3 dB in sound pressure level and represents a doubling of sound energy
5. The SPL's given here are for linear frequency weighting
|
Reference: 223, Figure 2.2, p. 8; NASA-STD-3000 69
5.4.2.1 Acoustic Environments Design Considerations
{A}
Spacecraft crewmembers should be provided with an acoustic environment that will not cause injury or hearing loss, interfere with voice or any other communications, cause fatigue, or in any other way degrade overall man/machine system effectiveness.
A high noise level environment typically occurs during the launch (boost) phase. The primary concern is crewmember exposure that will cause hearing loss or interfere with intercom and radio voice transmission.
The on-orbit and flight phase of spacecraft missions is of relatively long duration. During work periods, the summation of the individual sound pressure levels from all operating systems and subsystems should not exceed exposure limits that will cause hearing loss or interfere with voice communication. Sleep and rest period noise levels should not exceed noise levels that interfere with sleep or comfort and the hearing of wanted sounds.
The entry phase is similar to the launch phase, because high-level noise typically occurs within the spacecraft for a relatively short time. Hearing loss and interference with intercom and radio voice transmission are of primary concern.
5.4.2.1.1 Launch Phase Acoustic Environment
{L}
The noise environment within the spacecraft during the launch phase is, initially, the result of high level jet noise of the booster rockets impinging on the outer surface of the fuselage and being transmitted to the spacecraft interior. As the spacecraft accelerates from its launch pad, noise reduces due to loss of ground reflection, and jet noise diminishes as velocity increases. With increasing velocity, however, the crew compartment receives aerodynamic noise generated by boundary layer turbulence along the outer surface of the fuselage. This boundary layer noise reaches its maximum level as the spacecraft passes through the range of maximum dynamic pressure and decreases progressively thereafter. Aerodynamic noise becomes insignificant approximately two minutes after liftoff.
Figure 5.4.2.1.1-1 shows Space Shuttle Orbiter noise, external and internal, of the crew module during the atmospheric launch phase. Crewmember exposure is less than the internal noise level because of the attenuation offered by helmets.
Figure 5.4.2.1.1-1 Space Shuttle Orbiter Crew Module Noise Survey Launch Phase.
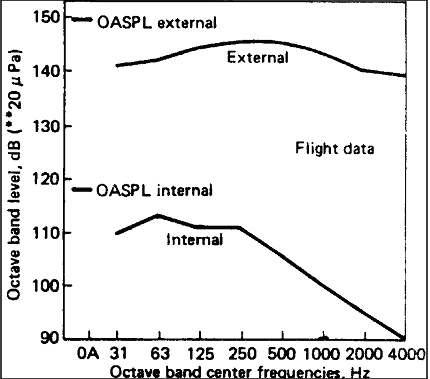
Note: OASPL = Overall Sound Pressure Level
|
Reference: 214, p. 24; NASA-STD-3000 74
5.4.2.1.2 On-Orbit Phase Acoustic Environment
{O}
The flight and on-orbit acoustic environment within the spacecraft is composed of continuous (long-duration) and intermittent (short-duration) noises.
a. Typical continuous sources of on-orbit noise are:
1. Environmental control equipment, (e.g., motors, fans, pumps).
2. Avionics equipment (e.g., transformers, oscillators).
b. Typical intermittent sources of on-orbit noise are:
1). Waste control system pumps, fans, valves.
2). Galley fans.
3). Personal hygiene station pumps, fans, valves.
4). Pressure regulators.
5). Thruster firings.
Figure 5.4.2.1.2-1 shows Space Shuttle Orbiter mid-deck and flight deck noise spectra during the on-orbit phase. Component noise spectra of individual prime noise sources are included.
Figure 5.4.2.1.2-1 Space Shuttle Orbiter On-Orbit Noise
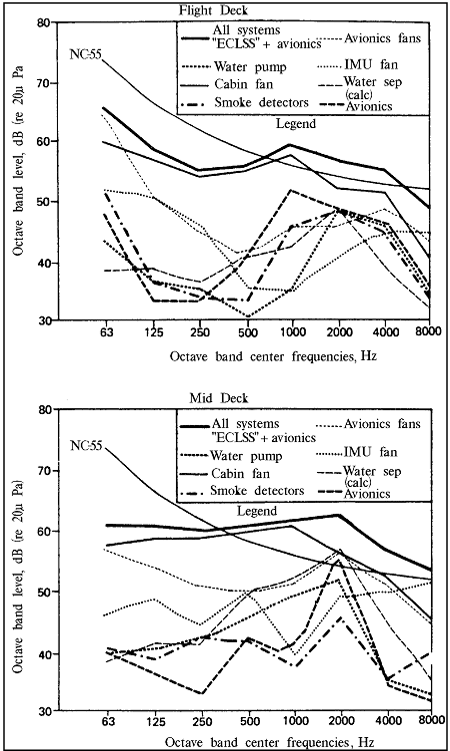
Reference: 214, p. 65; NASA-STD-300075
5.4.2.1.3 Entry Phase Acoustic Environment
{L}
The noise environment within the spacecraft during the entry phase is dominated by boundary-layer turbulence containing broadband noise of high intensity. The sound pressure levels during entry are comparable with those produced during the maximum dynamic pressure at launch, but the high intensities may be maintained for a longer period of time during entry.
5.4.2.2 Propagation of Noise Design Considerations
{A}
Noise and vibration travel different paths to reach the ear. Airborne noise travels through the air ducts and other openings that exist in enclosures as well as directly between source and ear for exposed equipment. Noise emitted into equipment enclosures, such as the avionics and equipment bays, couples with the enclosure surfaces and reradiates into the crew module where the noise again reaches the ear through airborne transmission. Vibration generated by rotating motors, fans, pumps, and transformer oscillations travel through the structural support members and is finally radiated as sound from vibrating surfaces in the crew module. The amount of noise reaching the receiver is dependent on the source level and the degree to which the transmission paths reduce the disturbances due to various attenuation factors encountered along the way.
The structure-borne acoustic noise loss factors will change between terrestrial gravity and one-atmosphere conditions to on-orbit microgravity and no-atmosphere conditions. The effect on infrasonic and low frequency noise in a spacecraft is especially significant, because propagation of low-frequency energy through the spacecraft pressure hull into the vacuum of outer space cannot occur.
5.4.2.3 Human Responses to Noise Design Considerations
{A}
The most significant effects of noise and transient pressures on humans are damage to hearing, masking of speech and warning signals, and annoyance. In addition, noise interferes with some human sensory and perceptual capabilities and thereby may degrade critical task performance. Noise may also produce temporary or permanent alterations in body chemistry.
The effects of noise on human responses can be categorized as follows:
a. Physiological effects - nonauditory responses.
b. Performance effects - masking.
c. Annoyance - perceived noisiness, and sleep interference.
d. Fatigue - Resulting from attempting to speak over elevated noise levels.
Recommended references on human responses to noise are References 10,
92, and 223.
5.4.2.3.1 Physiological Effects of Noise
{A}
Exposure to intense sound may result in temporary and/or permanent hearing loss. The severity of the loss is dependent upon the duration of exposure, the physical characteristics of the sound (intensity, frequency, pure or wide-band), and the nature of the exposure (continuous or intermittent).
For various exposure times to a given amount of acoustic energy, continuous noise causes greater temporary hearing loss for unprotected ears than does impulse noise.
Figure 5.4.2.3.1-1 lists many of the physiological effects of noise for various conditions of exposure.
| Reported disturbances |
Condition of exposure |
| Sound Pressure Level (dB) re: 20 µ Pa |
Spectrum |
Duration |
| Reduced visual acuity; chest wall vibrations; gag sensations; respiratory rhythm
changes. |
150 |
1-100 Hz |
2 min |
| Reflex
response of tensing, grimacing, covering the ears, and urge to avoid or
escape |
100 |
|
Sudden onset |
| Pain in the ears |
135 |
20-2,000 Hz |
|
| Pain in the ears |
160 |
3 Hz |
|
| Discomfort in the ear |
120 |
300-9,600 Hz |
2 sec |
| Hearing Temporary Threshold Shift of 10 dB |
94 |
4000 Hz |
15 min |
| Hearing Temporary Threshold Shift of 10 dB |
100 |
4000 Hz |
7 min |
| Hearing Temporary Threshold Shift of 10 dB |
106 |
4000 Hz |
4 min |
| Tympanic
membrane rupture |
155 |
2,000 Hz low freq. |
Continuous blast |
| Tympanic membrane rupture |
175 |
|
|
| Mechanical
vibrations of body felt; during sensations |
120-150 |
OASPL |
|
| Vertigo and, occasionally, disorientation, nausea and vomiting |
120-150 |
1.6 To 4.4 Hz |
Continuous |
| Irritability and fatigue |
120 |
OASPL |
|
| Temporary Threshold Shift occurs |
65 |
Broadband |
60 days |
| Human lethality |
167 |
2000 Hz |
|
| Human lethality |
161 |
2000 Hz |
|
| Temporary Threshold Shift occurs |
75 |
8 to 16 kHz |
5 min |
| Temporary Threshold Shift occurs |
110 |
20 to 31.5 kHz |
45 min |
|
Notes:
TTS - Temporary Threshold Shift
SPL - Sound Pressure Level re: 20 Pa
|
Reference: 10, pp. 9-40, 41, 43, 47, 48;
15, p. 381; 92,
pp. 719, 733, 738; NASA-STD-3000 76
Other observed physiological effects of noise are:
a. Noise exposure causes increases in the concentration of corticosteroids in the blood and brain and affects the size of the adrenal cortex. Continued exposure is also correlated with changes in the liver and kidneys and with the production of gastrointestinal ulcers.
b. Electrolytic imbalances (magnesium, potassium, sodium, and calcium) and changes in blood glucose level are associated with noise exposure.
c. The possibility of effects on sex-hormone secretion and thyroid activity is indicated.
d. Vasoconstriction, fluctuations in blood pressure, and cardiac muscle changes have been reported. Vasoconstriction in the extremities, with concomitant changes in blood pressure, have been found for noises of 70 dB SPL, and these effects become progressively worse with higher levels of exposure.
e. Abnormal heart rhythms have been associated with occupational noise exposure; this and other evidence support the tentative conclusion that noise may cause cardiovascular disorders.
f. High intensity sound changes the mode of the stapes (in the middle ear), reducing the stimulus to the cochlea. An additional protective mechanism causes the stapedius and tensor tympana muscles to contract, which stiffens the middle ear ossicular chain. This reflex occurs about 10 m sec. after the initial onset of loud noise.
5.4.2.3.2 Performance Effects of Noise
{A}
Masking of speech occurs when the presence of one sound, such as noise, inhibits the perception of another sound. Hence, a given frequency will mask signals at neighboring frequencies rendering them completely inaudible.
Crewmember's efficiency is impaired when noise interferes with voice communications. The frequencies used for voice communication range from about 200 to 6000 Hz. When this occurs, the penalty is an increase in time required to accomplish communication through slower, more deliberate verbal exchanges. This results in increased possibilities of human error due to misunderstandings. Crewmember's communication limitations must be considered an integral part of the system in which they perform (see
Figure 5.4.2.3.2-1).
Figure 5.4.2.3.2-1 Speech Interference Level (SIL) Criteria for Voice Communications
Speech interference level (dB)
|
Person to person communication
|
|---|
|
30 - 40
|
Communication in normal voice satisfactory
|
|
40 -50
|
Communication satisfactory in normal voice 1 to 2m (3 to 6ft), and raised voice 2 to 4m (6 to 12ft), telephone use satisfactory to slightly difficult
|
|
50 - 60
|
Communication satisfactory in normal voice 30 to 60cm (1 to 2ft), raised voice 1 to 2m (3 to 6ft), telephone use slightly difficult.
|
|
60 - 70
|
Communication with raised voice satisfactory 30 to 60 cm ( 1 to 2ft) slightly difficult 1 to 2m (3 to 6ft), telephone use difficult. Ear plugs and/or ear muffs can be worn with no adverse effects on communications.
|
|
70 - 80
|
Communication slightly difficult with raised voice 30 to 60 cm (1 to 2ft), slightly difficult with shouting 1 to 2m (3 to 6ft). Telephone use very difficult. Ear plugs and/or ear muffs can be worn with no adverse effects on communication.
|
|
80 - 85
|
Communication slightly difficult with shouting 30 to 60 cm (1 to 2ft). Telephone use unsatisfactory. Ear plugs and/or ear muffs can be worn with no adverse effects on communication.
|
|
Overall speech level(dB) minus SIL (dB)*
|
Communications via earphones or loudspeaker
|
|
+ 10 dB or greater
|
Communication satisfactory over range of SIL 30 maximum **SIL** permitted by exposure time.
|
|
+ 5dB
|
Communication slightly difficult. About 90 percent of sentences are correctly heard over range of SIL 30 to maximum SIL permitted by exposure time.
|
|
0 dB to - 10 dB
|
Special vocabularies (i.e., radio-telephone voice procedures) required.
Communication difficult to completely unsatisfactory over range of SIL 30 to maximum SIL permitted by exposure time.
|
|
* The overall long-time RMS sound pressure level of speech and the SIL for the noise must be measured at or estimated for a position in the ear canal of the listener. The long-time RMS value of speech can be approximated by subtracting 4 dB from the peak VU meter readings on monosyllabic words.
** Ear plugs and/or muffs worn in noise having SIL's above 60 dB will not adversely affect communication and will extend maximum permissible SIL in accordance with protection provided.
|
Reference: 5, Table XXIX, p. 279; NASA-STD-3000 77
The sound reflected from room surfaces is known as reverberation. If the delay relative to the original sound is small, the reflections and the original will fuse and be heard singly by the listener. If the delay is long, a separate sound (an echo) will be heard.
If the reverberation time is long, the room is termed live and a spoken word is heard first directly and then as a series of reflections. A certain amount of reverberation is desirable because it makes speech sound alive and natural. Too much reverberation is undesirable because reflections arrive at the same time as a subsequent word and interfere with its perception.
If the reverberation time is short, the room is termed dead. There is less interference between words but, because the sound of the word decays before it can propagate through the room, communication may be reduced.
Figure 5.4.2.3.2-2 lists many of the performance effects of noise on humans as a condition of exposure. Other observed performance effects of noise are:
Figure 5.4.2.3.2-2 Performance Effects of Noise on Humans
| Performance Effects |
Condition of exposure |
| SPL (dB)re: 20 µ Pa |
Spectrum |
Duration |
| Reduced ability to balance on a thin rail |
120 |
Broadband |
|
| Chronic fatigue
|
110 |
Machinery noise |
8 hr |
| Reduced visual acuity, stereo-scopic acuity, near point accommodation |
105 |
Aircraft engine noise |
|
| Vigilance decrement; altered thought processes; interference with mental work |
90 |
Broadband |
Continuous |
| Fatigue, nausea, headache |
85 |
1/3-octave@ 16 kHz |
Continuous |
| Degraded astronauts' performance |
75 |
Background noise in spacecraft |
10-30 days |
| Performance degradation of multiple-choice, serial-reaction tasks |
90 |
Broadband |
|
| Overloading of hearing due to loud speech
|
100 |
Speech |
|
| Affects person-to-person voice communication |
See Fig. 5.4.2.3.2-1 |
|
|
| Hearing TTS at 2 minutes |
70 |
4000 Hz |
|
| Hearing TTS at 2 minutes after exposure |
155 |
|
8 hr
100 impulses
|
|
Note: TTS at 2 minutes (** TTS2 **)
|
Reference: 5, p. 279; 10,
pp. 9-49, 50; 15, p. 381; 92,
p. 725; 223, pp. 239, 249 NASA-STD-3000
78
a. Continuous regular periodic and aperiodic noise reduces performance on a complex visual tracking task. At levels of 50, 70 and 90 dB of white noise, the greatest decrement occurred with the highest noise level.
b. As the noise intensity increases, increased arousal causes an improvement in task performance up to a point; beyond that level of intensity, over arousal sufficient to degrade task performance occurs.
c. Psychological effects of noise can include anxiety, learned helplessness, degraded task performance, narrowed attention, and/or other adverse after effects.
5.4.2.3.3 Annoyance Effects of Noise
{A}
The term annoyance refers to the degree noise is perceived to be unwanted, objectionable, or unacceptable. High noise levels can delay the onset of sleep, awaken one from sleep, and interfere with rest and with the hearing of wanted sounds. In the presence of objectionable noise levels, long path transmission voice communications cannot be tolerated as easily. Noise is stressful when it creates feelings of emotion, i.e., surprise, fear, anger, frustration, etc. Noise is annoying when it begins to interfere with low-level conversational speech (especially intermittent noise), becoming noticeable at 50 dB(A). The threshold for noise annoyance varies depending on the sensitivity and mental state of the individual.
5.4.2.4 Noise Exposure Limits Considerations
{A}
Spacecraft crewmember noise exposure limits are established by criteria for:
a. Hearing conservation.
b. Communication requirements.
c. Habitability requirements.
The types of noise that need to be considered are steady state noise (22.4 to 11,200 Hz), and impulse noise.
Infrasonic and ultrasonic noise, though beyond the range of hearing, have a physiological effect on humans and should be considered. The duration of noise exposure directly affects permissible noise limits and should be considered. Also, noise criteria limits should be applied which enable certain tasks to be performed without degradation.
5.4.2.4.1 Hearing Conservation Criteria Considerations
{A}
Hearing conservation criteria have been established which, when exceeded, are indications for the employment of hearing conservation measures. Hearing conservation criteria are based on comprehensive statements of the relation between various descriptive parameters of the noise exposure, such as sound pressure level and exposure time, and the probability of temporary or permanent hearing loss. Material design standards evolve from consideration of hearing damage risk, speech intelligibility, and annoyance factors intended to cover typical operational conditions.
5.4.2.4.1.1 Long-Term Hearing Conservation Criteria Considerations
{A}
Long-term noise may be continuous, intermittent or fluctuating, with the sound pressure level varying over a wide range, provided such variations have a duration exceeding one second.
5.4.2.4.1.1.1 Wide-Band, Long-Term Hearing Conservation Considerations
{A}
Wide-band or continuous sound is the spectrum of a wave whose components are continuously distributed over a frequency region. Audio frequencies range from approximately 15 to 20,000 Hz.
The equivalent continuous noise level (Leq) is the constant sound level that is equivalent to a varying sound level during a specified sample time. Implicit in this equivalence is an exchange rate between sound level and time of 5 dB per doubling of time. [See Reference
58, Paragraph 3.5, for method of calculating Leq].
Audible noise with constant sound levels of 85 dB(A) or greater is considered hazardous regardless of the duration of exposure. Hearing protection devices need to be provided during exposure to conditions of exposure to noise levels of 85 dB(A) or greater. Crewmembers should not be exposed to continuous noise levels which exceed 120 dB in any octave band or 135 dB overall sound pressure level (PASPL) under any circumstances.
5.4.2.4.1.1.2 Narrow-Band, Long-Term Hearing Conservation Considerations
{A}
If the sound pressure level of any one-third octave band exceeds the level in the adjacent one-third octave bands by 5 dB or more, that band and associated octave band shall be considered to contain pure tone or narrow-band components. Narrow-band noise is a simple or complex tone or line spectra having intense and steady state frequency components, relative to wideband noise components, in a very narrow band (1% of the octave band or 5 Hz, whichever is less) and is heard as a musical sound, either harmonic or discordant.
5.4.2.4.1.2 Short-Term Hearing Conservation Criteria Considerations
{A}
Short-term noise exposure is that period required for spacecraft launch and boost phase, the entry phase, and other conditions normally not exceeding five minutes continuous duration.
Also, impulse or impact noise that may occur during any phase of spacecraft operation is considered to be short-term noise exposure.
5.4.2.4.2 Voice Communications Criteria Considerations
{A}
Intelligibility is the psychological process of understanding meaningful words, phrases, and sentences that may occur face-to-face or over communication systems. For satisfactory communication of most voice messages in noise, 75% intelligibility is required. The ratio of speech level to background noise level affects intelligibility.
5.4.2.4.2.1 Direct Voice Communications Criteria Considerations
{A}
Direct (face-to-face) communication provides visual cues that enhance voice communication intelligibility in the presence of background noise. The distance from speaker to listener, background noise level, and voice level are important considerations. Ambient air pressure and gaseous composition of the air are important considerations, because they affect voice efficiency and frequency content.
5.4.2.4.2.2 Indirect Voice Communications Criteria Considerations
{A}
Indirect voice communication systems lack visual cues that aid in speech intelligibility. The Articulation Index , (AI) should be used to calculate speech intelligibility in voice communication situations other than face-to-face. Standards for calculating the AI are described in Reference
222. The relationship between AI and various measures of speech intelligibility criteria are shown in
Figure 5.4.2.4.2.2-1. Articulation Index criteria is given in
paragraph 5.4.3.2.2.2.
Figure 5.4.2.4.2.2-1 Articulation Index and Speech Intelligibility
Reference: 19, Sub 1.4 (1), p. 1.9; NASA-STD-3000 79
5.4.2.4.3 Annoyance Criteria Considerations
{A}
Problems of annoyance and task disruption will be minimal if acoustic requirements for acceptable speech communication, sleep, and rest are met.
5.4.2.4.3.1 Long-Term Annoyance Noise Criteria Considerations
{A}
Long-term noises that can cause annoyances affecting sleep and rest periods and the hearing of wanted sounds are broad-band random noise or narrow-band noise with tone components. Long-term noise may be continuous, intermittent, or fluctuating, provided that such variations have a duration exceeding one second. Inaudible infrasonic and ultrasonic noise frequencies can also produce annoying effects.
5.4.2.4.3.2 Short-Term Annoyance Noise Criteria Considerations
{A}
Short-term annoyance noise exposure does not exceed five minutes continuous duration. This includes wide-band random noise, narrow-band noise or tones, impulse or impact noise, and intermittent noise.
5.4.3 Acoustics Design Requirements
{A}
This section defines the basic environmental limitations and criteria that the designer shall apply to the design of crew stations and other habitable compartment areas.
Noise levels shall be specified in terms of A-weighted sound level, L(A). Noise exposure over 24 hour periods shall be specified in terms of the equivalent A-weighted sound level La eq. The maximum allowable on orbit continuous broad band sound pressure exposure limits produced by the summation of all individual sound pressures from all sources, including all operating systems, subsystems and payloads, considered over a 24 hour period are defined in the following paragraphs.
5.4.3.1 General Acoustic Design Requirements
{A}
The following general acoustic design requirements shall be observed:
a. General Acoustic Design - Noise generation and penetration shall be controlled to the extent that acoustic energy will not cause personnel injury, interfere with voice or any other communications, induce fatigue, or contribute to the degradation of overall man-machine effectiveness.
(All sound pressure levels in decibels are referenced to 20 u-Pascals unless otherwise stated and are to be measured at or translated to the outer ears of crewmembers.)
b. Equipment Noise:
1.Equipment shall be designed to meet noise requirements of MIL-STD-1474B.
2. All noisy equipment shall be mounted and located to reduce noise at crewmember stations.
3. System designs shall include noise control provisions.
4. Means shall be provided onboard to facilitate measurement of acoustic noise levels to verify that exposure limits are not being exceeded.
5.4.3.2 Noise Exposure Requirements
{A}
The following types of noise shall be taken into account:
a. Wide-band random noise (22.4 to 11,200 Hz).
b. Narrow-band noise and tones.
c. Impulse noise.
d. Infrasonic and ultrasonic noise.
There are three sets of noise requirements that shall be satisfied depending on crewmember task and acceleration regimes: 1) hearing conservation, 2) voice communication, and 3) annoyance.
5.4.3.2.1 Hearing Conservation Noise Exposure Requirements
{A}
a. Maximum Noise Exposure - A maximum noise exposure of 115 dB(A) is allowable, providing the duration does not exceed two minutes during a 24-hour period.
b. Hearing Protection Devices - Hearing protection devices shall be provided for use during exposure to noise levels of 85 dB(A) or greater.
5.4.3.2.1.1 Wide-Band, Long-Term Hearing Conservation Noise Exposure Requirements
{A}
The following long-term, wide-band hearing conservation noise exposure criteria shall apply:
a. Hazard Level - Noise of constant sound levels of 85 dB(A) and greater are considered hazardous regardless of the duration of exposure. Total exposure during a 24-hour period shall not exceed an average of 80dB(A).
b. Allowable Noise Exposure - A noise exposure below 84 dB(A) for up to eight hours duration without hearing protection is allowable but not desirable.
c. Unacceptable Noise Levels - Crewmembers shall not be exposed to continuous noise levels that exceed 120 dB in any octave band or 135 dB OASPL under any circumstances.
5.4.3.2.1.2 Narrow-Band, Long-Term Hearing Conservation Noise Exposure Requirements
{A}
The relative sound pressure levels of narrow-band components, pure-tones, and beat frequencies shall be limited to a level at least 10 dB lower than the allowed maximum sound pressure level of the octave-band that contains the component.
5.4.3.2.1.3 Impulse Hearing Conservation Noise Exposure Requirements
{A}
Maximum Noise Level (Hearing Conservation Criteria) - Impulse sound is a change in sound pressure level of more than 10 dB in one second or less. Impulse noise shall not exceed 140 dB peak pressure level to meet hearing conservation criteria for unprotected ears.
(See MIL-STD-1474B (Ref. 58) regarding the relationship between the number of daily exposures, the corresponding peak levels, B-duration values, and the required hearing protection devices when impulse peak pressure levels exceed 140 dB.)
5.4.3.2.1.4 Infrasonic, Long-Term Annoyance Noise Exposure Requirements
{A}
The following infrasonic noise annoyance criteria shall apply:
a. Infrasound Sound Pressure Level - Infrasound sound pressure level shall be less than 120 dB in the frequency range of 1 to 16 Hz for 24-hour exposure.
b. Hearing Protection - Passive hearing protection devices shall not be a method for low-frequency infrasound noise control.
5.4.3.2.1.5 Ultrasonic, Long-Term Annoyance Noise Exposure Requirements
{A}
The following ultrasonic noise annoyance criteria shall apply:
a. Hearing Conservation Measures - Hearing conservation measures shall be initiated when the ultrasonic criteria provided in
Figure 5.4.3.2.1.5-1 are exceeded.
Figure 5.4.3.2.1.5-1 Airborne High Frequency and Ultrasonic Hazard Noise Limits
| One third octave band center frequency, kHz |
One-third octave band level in dB |
|---|
| 10 |
80 |
| 12.5 |
80 |
| 16 |
80 |
| 20 |
105 |
| 25 |
110 |
| 31.5 |
115 |
| 40 |
115 |
Reference: 281, p. 1-3; NASA-STD-3000 401
b. Hearing Protection - Ultrasonic noise hearing protection shall be provided where overexposure is possible and in such a way that communication is not hampered.
5.4.3.2.2 Voice Communication Noise Exposure Requirements
{A}
5.4.3.2.2.1 Direct Voice Communications Noise Exposure Requirements
{A}
The following noise level criteria shall apply to areas where voice communications are necessary:
a. Voice Communication Criteria - The communication criteria shown in Figure 5.4.3.2.2.1-1 shall be used to define maximum noise level based on voice communication requirements.
b. Background Noise Level - Background noise for work areas shall not exceed the NC 50 contour unless otherwise specified. (Refer to
Figure 5.4.3.2.2.1-1).
c. Room reverberation time -
1. The reverberation time of a spacecraft compartment shall be adjusted according to room volume and the criterion for conversational speech as shown in
Figure 5.4.3.2.2.1-2.
2. In areas where crewmember display users must communicate by voice, provide a room reverberation time of approximately 0.5 seconds.
3. Reverberation time shall be verified utilizing the natural frequency of the system.
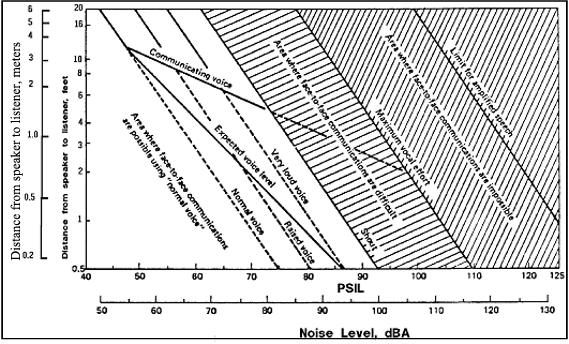
Reference: 19, Sub 1.1 (1), p. 2;
NASA-STD-3000 81
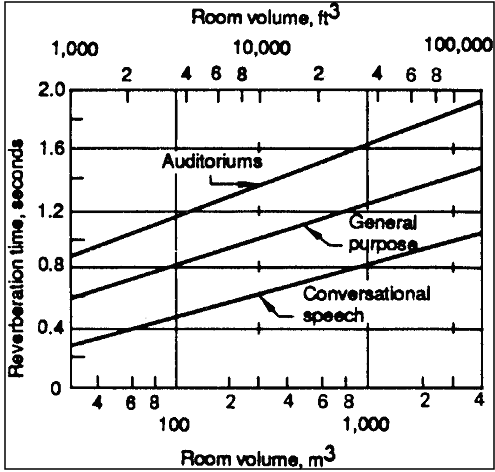
Reference: 4, Figure 6.6-12, p. 6.6-17;
NASA-STD-3000 82
5.4.3.2.2.2 Indirect Voice Communications Noise Exposure Requirements
{A}
The following intelligibility criteria for Articulation Index (AI) shall apply:
a. Very Good to Excellent Intelligibility - AI = 0.7 to 1.0.
b. Good Intelligibility - AI = 0.5 to 0.7.
c. Generally Acceptable Intelligibility - AI = 0.3 to 0.5.
d. Unsatisfactory or Only Marginally Satisfactory - AI = 0.0 to 0.3.
Reference Figure 5.4.2.4.2.2-1.
5.4.3.2.3 Annoyance Noise Exposure Requirements
{A}
5.4.3.2.3.1 Wide-Band, Long-Term Annoyance Noise Exposure Requirements
{A}
The following long-term, wide-band annoyance noise criteria shall apply:
a. Maximum Continuous Noise - The maximum allowable continuous broad band sound pressure levels produced by the summation of all the individual sound pressure levels from all operating systems and subsystems considered at a given time shall not exceed the Noise Criteria (NC) 50 contour for work periods and the NC 40 contour for sleep compartments shown in
Figure 5.4.3.2.3.1-1. Also see Figure
5.4.3.2.3.1-2 for correlation of the NC curves to the A-Weighted sound pressure levels
b. Sleep Compartment Noise Level
1. In sleep areas, the continuous broad-band noise level shall not be less than NC25 contour.
2. Hearing protection devices shall be available in sleep areas to provide aural isolation as needed.
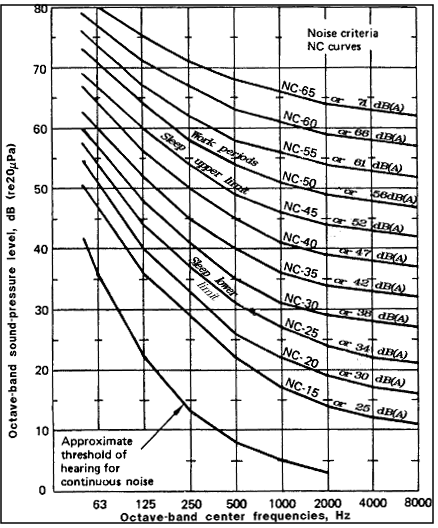
Reference: 90, p. 6; NASA-STD-3000 83
Figure 5.4.3.2.3.1-2 A-Weighted
Sound Pressure Level as Weighted to the NC Curve
| NC Curve |
A- Weighted Sound Pressure Level dB (A) |
|---|
|
70
|
80
|
|
65
|
72
|
|
60
|
67
|
|
55
|
63
|
|
50
|
58
|
|
45
|
53
|
|
40
|
49
|
|
35
|
44
|
|
30
|
40
|
|
25
|
36
|
|
20
|
31
|
|
15
|
27
|
NASA-STD-3000 432
5.4.3.2.3.2 Narrow-Band Annoyance Noise Exposure Requirements
{A}
The maximum SPL of any narrow-band continuous component or tone shall be at least 10 dB less than the broad-band SPL of the octave-band which contains the component.
5.4.3.2.3.3 Wide-Band, Short-Term Annoyance Noise Exposure Requirements
{A}
The wide-band annoyance noise level as a result of long-term and short-term (less than five minutes) noise shall not exceed an Leq (8-hours) of 32 dB during the sleep period. Intermittent noises shall be minimized.
5.4.3.2.3.4 Impulse Annoyance Noise Exposure Requirements
{A}
The following impulse noise annoyance criteria shall apply:
a. Sleep/Rest Periods - Anticipated impulse or transient noises shall not exceed background noise by more than 10 dB during sleep/rest periods.
b. Masking Noise:
1. Masking noise generation to cover-up impulse or fluctuating noise is not a preferred solution but, where utilized, it shall not exceed 55 dB(A) at the crewmember's ear.
2. Masking noise level and spectrum shape shall be under the control of crewmembers.
5.4.3.2.4 Measurement of Noise Levels
{A}
Acoustic noise measurements shall be conducted in accordance with the requirements conforming to the sections on Instrumentation and Measurement in MIL-STD-1474B (Reference
58).
5.4.3.2.5 Noise Reduction For Equipment Upgrades
{A}
Mid-Program system upgrades shall include noise reduction according to the latest technical state of the art which is applicable to the equipment which is being upgraded.
5.4.4 Example Acoustics Design Solutions
{A}
The control of noise involves three interdependent elements:
a. Control at the source.
b. Interruption or absorption along the transmission path.
c. Personal hearing protection.
Noise reduction techniques that can be applied to space module are the same as used in industrial and building noise control.
5.4.4.1 Noise Control at the Source
{A}
The sources of equipment/system noise are vibration, impact, friction and fluid flow turbulence.
Figure 5.4.4.1-1 lists typical methods to control noise at the source.
5.4.4.2 Control of Noise Path Transmission
{A}
A source of acoustic noise can radiate sound directly into the air or induce vibrations into a structural path that, in turn, radiate into the air. Airborne noise can be reduced by 1) enclosure and barriers between noise source and crewmembers, 2) sound absorption linings, and 3) sealing of enclosure and perimeter wall penetrations.
Structurally transmitted vibration and radiated noise can be reduced by 1) vibration isolation of machinery supports and panels, 2) panel damping applications, 3) decoupling pipes from pumps with a section of hose, and 4) detuning vibration frequencies by panel stiffening.
The Space Shuttle Orbiter required noise control application to the IMU Cooling System. Inlet and outlet duct reactive/dissipative mufflers were developed and tuned to alleviate a 2000 Hz noise problem. The fan/heat exchanger is a single duct that was silenced by a straight- through, foam-lined, dissipative muffler. A 22 dB reduction in 2000 Hz octave-band noise was accomplished.
Figure 5.4.4.1-1 Typical Noise Source Corrective Actions
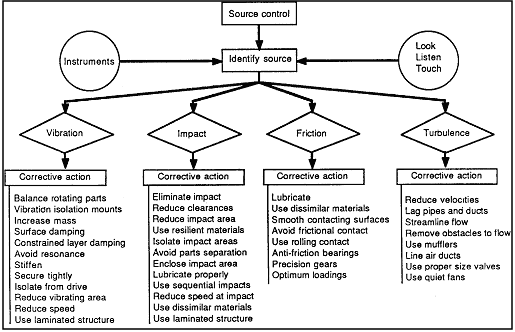
Textual version:
1. Source control. 2. Identify source using instruments and
senses (look, listen, touch).
For Vibration - Corrective action: Balance rotating parts, Vibration
isolation mounts, increase mass, surface damping, constrained layer damping,
avoid resonance, stiffen, secure tightly, isolate from drive, reduce vibrating
area, reduce speed, use laminated structure.
For Impact - Corrective action: Eliminate impact, reduce clearances,
reduce impact area, use resilient materials, isolate impact areas, avoid parts
separation, enclose impact area, lubricate properly, use sequential impacts,
reduce speed at impact, use dissimilar materials, use laminated structure.
For Friction - Corrective action: Lubricate, use dissimilar materials,
smooth contacting surfaces, avoid frictional contact, use rolling contact,
anti-friction bearings, precision gears, optimum loadings.
For Turbulence - Corrective action: Reduce velocities, lag pipes and
ducts, streamline flow, remove obstacles to flow, use mufflers, line air ducts,
use proper size valves, use quiet fans.
|
NASA-STD-3000 84
5.4.4.3 Hearing Protection
{A}
Noise that has not been sufficiently reduced requires the use of hearing protection devices. These devices consist of earplugs, ear muffs, noise-attenuating helmets, or combinations of these. TB MED 501 (Reference
281) provides information regarding acceptable personal hearing protective devices.
The Space Shuttle Orbiter noise level during the launch phase is 149 dB (external) and 118 dB (internal). A NASA helmet equipped with communication-type earmuffs will provide 5 to 42 dB attenuation over the range of frequencies from 63 Hz to 8,000 Hz, reducing launch noise at the crewmember's ear to about 110 dB. The NASA helmet reduces launch noise from 107.7 dB(A) to 92.7
dB(A).
5.5 VIBRATION
{A}
5.5.1 Introduction
{A}
This section provides the design considerations, requirements and examples for vibration. Vibratory environments, propagation of vibratory energies, human responses to vibration, and exposure criteria are included. Low frequencies in the range of 0.1 to 1 Hz and higher frequencies from 1 to 80 Hz are presented. Control and protection are also covered.
NOTE: The following symbology has been used throughout this document:
small "g" = vibrational g loads (applied input forces)
capital "G" = linear acceleration G reactions
(Refer to Paragraph 5.3.1, Acceleration Introduction, for acceleration vector conventions.)
5.5.2 Vibration Design Considerations
{A}
The vibration environment in space operations covers a wide range of amplitudes and frequencies. Vibration due to space module booster and control rockets, aerodynamic loading, cabin machinery, and equipment must all be considered. In addition, insecurely fastened stowed items can be a source of vibration.
Vibration seldom occurs in the operational situation as a single isolated variable. Other environmental variables such as weightlessness, linear acceleration, etc., can be expected to interact with vibration either to reduce or to increase the debilitating effects. Equipment variables include size of graduations or illumination of instruments, inflated pressure suits, etc.; procedural variables include task load, variations in time of performance, etc.; and, finally personal variables, such as fatigue and deconditioning. The effects of some of these can be predicted at this time; others must await further research.
Studies of human response to vibration have been conducted in field environments and in complex laboratory simulations. However, most of the available information results from laboratory experiments.
The most useful information shows the effects of changing the characteristics of the vibration (magnitude, frequency, etc.), the influence of modifying the transmission of vibration to the body (by seating and postural alterations), the sources and extent of individual variability, and the effects of alterations to the operator's task.
5.5.2.1 Vibration Environments Design Considerations
{A}
Effects of vibration of the whole body are usually expressed in terms of vibration measured at the interface between the body and the vibrating surface. Vibration of displays and hand controls should also be assessed.
Vertical vibration resulting from general support surfaces is most frequently of interest but other axes and input positions can be important.
All effects of vibration depend on vibration frequency. Some effects are restricted to narrow ranges of frequency.
The influence of vibration duration has not been well studied. Current information shows small or inconsistent effects of duration on task performance. Duration of vibration may cause discomfort or onset of motion sickness.
Vibratory environments have complex motions that vary greatly in magnitude, frequency, direction, and duration. Detailed analysis of motions (including spectral analysis) is required when considering motion effects. The motions may produce several different effects or one dominant effect.
5.5.2.1.1 Launch Phase Vibration Environment
{L}
Significant levels of vibration occur routinely in space module operations during the maximum aerodynamic pressure portion of boost. The vibration is coupled with a significant linear acceleration bias.
The Mercury astronauts complained that vibration during boost interfered with their vision. The Titan II rocket engine produced intense vibration at 11 Hz.
Vibration during the Apollo flights varied significantly with phase of the flight. On the launch pad and during launch the main source of vibration is the rocket booster engine. Low-frequency vibrations are maximum as the missile shudders on the pad at the moment of launch but are of very short duration. The frequency of such vibrations changes with the length and mass of the missile. Hence, as the stages are jettisoned, the vibrations change from an initial frequency of 20 Hz for the first stage to 50 Hz for the third stage. Guidance corrections during launch may add low-frequency transverse peak oscillations of 1-g or less.
5.5.2.1.2 On-Orbit Phase Vibration Environment
{O}
During orbital flight, vibration is minimal. The internal motors for pressurization, air conditioning, and pumping systems are potential sources of vibration. Other structure-borne vibrations during orbital flight are difficult to predict.
5.5.2.1.3 Entry Phase Vibration Environment
{L}
Significant vibration levels occur during reentry but these levels are not as intense as experienced during the launch phase. The vibration is coupled with a significant linear deceleration bias.
During entry, low-frequency oscillation may occur if the entry angle is too steep. If the angle is more than one or two degrees, high peak oscillation, depending on the shape of the vehicle, may be produced. The frequency of such oscillations reach a peak coincident with the entry deceleration peak. The amplitude of the oscillation progressively decreases during deceleration. For an entry angle of ten degrees, a 2 Hz oscillation with a peak of 0.12-g and an arc of one degree has been predicted. Skip- glide entry of a lift-drag vehicle may produce oscillations.
5.5.2.2 Vibration Propagation Design Considerations
{A}
Vibration refers to alternating motion of a body with respect to a reference point. This section is concerned with solid-borne or mechanical vibration that is transmitted directly to the crewmember by way of the buttocks, hands, feet, etc.
Vibration can be transmitted from the source to the crewmember by a direct mechanical path or by several flanking paths. Airborne noise impinging on structure can induce structural vibration that can be transmitted to the crewmember via support structure. Mechanical vibration is transmitted by compression, shear, and torsional forces. The amount of vibration energy that arrives at the crewmember depends on the major transmission paths between source and receiver, coupling loss factors, and the modes of mechanical response. A crewmember's seat, foot restraints, handholds etc., are important elements in the vibration path. Design of mountings deserve special attention in reducing vibrations.
5.5.2.3 Human Responses to Vibration Design Considerations
{A}
Vibration may affect crewmembers performance, and may produce physiological and biodynamic effects, as well as subjective or annoyance effects.
Whole-body vibration may act additively with noise (Paragraph
5.4) to cause stress and fatigue and degrade vigilance and performance.
There has been limited research combining vibration with other environmental stressors such as acceleration, noise, and altitude. At 3.5 G, vibration levels above +0.30 gx at 11 Hz are believed to affect crewmember performance. A G-bias apparently can change some body vibration resonances as well as lower tolerance limits. At 1-G the abdominal mass resonance occurs at 4-8 Hz. At 2.5-G a subject noted awareness of stomach vibrating between 9.5 and 12.5 Hz.
(Refer to Paragraph 5.9, Combined Environmental Effects, for more details.)
Additional studies are needed to determine the effects of increasing vibration magnitude on impedance for higher G-bias levels simulating liftoff and launch.
5.5.2.3.1 Physiological Effects of Vibration
{A}
The physical responses of the body are primarily the result of the body acting as a complex system of masses, elasticities, dampings, and couplings in the low frequency range, i.e., up to 50 Hz. The impedance of the body and its parts and organs damp vibration over certain frequency ranges and may amplify vibration over other frequency ranges within various portions or all of the body
Vibration energy transferred from supporting structure to the crewmember is the primary determinant of biological effects which, in turn, cause decrements in performance and discomfort. Frequencies that correspond to body resonances of organs and limbs result in amplified motion of the resonant body component.
Figure 5.5.2.3.1-1 lists various parts of the body and the approximate frequency where mechanical resonance occurs.
Figure 5.5.2.3.1-1 Body-Part Vibrant Resonant Frequency Region (1-G Bias)
| Body component |
Resonant frequency (Hz) |
| Whole body, standing erect |
6 & 11-12 |
| Whole body, standing relaxed |
4-5 |
| Whole body, (transverse) |
2 |
| Whole body, (sitting) |
5-6 |
| Head |
20-30 |
| Head, sitting |
2-8 |
| Eye ball |
40-60 |
| Eardrum |
1000 |
| Head/shoulder, standing |
5 & 12 |
| Head/shoulder, seated |
4 -5 |
| Shoulder/head, transverse rib
|
2-3 |
| Main torso
|
3-5 |
| Shoulder, standing |
4-6 |
| Shoulder, seated |
4 |
| Limb motion |
3-4 |
| Hand |
1-3 |
| Hand |
30-40 |
| Thorax |
3.5 |
| Chest wall |
60 |
| Anterior chest |
7-11 |
| Spinal column |
8 |
| Thoraco-abdominal viscera semi-supine) |
7-8 |
| Abdominal mass |
4-8 |
| Abdominal wall |
5-8 |
| Abdominal viscera |
3-3.5 |
| Pelvic area, semi-supine |
8
|
|
Hip, standing
|
4
|
|
Hip, sitting
|
2-8
|
|
Foot, seated man
|
>10
|
Reference: 101, pp. 6 -33; 182,
pp. 4.1-5 and 4.105; 92, pp. 307-330; NASA-STD-3000 138
5.5.2.3.2 Performance Effects of Vibration
{A}
Vibration affects performance either by modifying perception or by influencing control movements. Frequencies that affect performance are shown in
Figure 5.5.2.3.2-1.
Figure 5.5.2.3.2-1 Sensitive Vibration Frequencies Affecting Human Performance
Activity
|
Frequency range (Hz)
|
|---|
|
Equilibrium
|
30 - 300
|
|
Tactile sense
|
30 - 300
|
|
Speech
|
1 - 20
|
|
Head movement
|
6 - 8
|
|
Reading (texts)
|
1 - 50
|
|
Tracking
|
1 - 30
|
|
Reading errors (instruments)
|
5.6 - 11.2
|
|
Manual tracking
|
3 - 8
|
|
Depth perception
|
25 - 40, 60 - 40
|
|
Hand grasping handle
|
200 - 240
|
|
Visual task
|
9 - 50
|
Reference: 10, pp. 8-38, 8-68, 8-79; 21,
Figure 1 (1), p. 1; 102, p, 4.110; NASA-STD-3000
139
The effect of vibration on performance depends on the source of the motion, type of motion, environmental conditions, response of the individual, and requirements placed on the individual.
Threshold for detection of vibration is approximately ± one min arc of visual angle; vibration amplitudes greater than those in
Figure 5.5.2.3.2-2 (± two min arc) may, depending on the task, affect reading ability.
Figure 5.5.2.3.2-2 shows mean amplitudes of observer vibration which produce visual blur of stationary point sources of light. Also shown are the amplitudes of z-axis whole-body vibration from ISO 2631 (1978).
Hand control performance is most often degraded by vibration which causes a mechanical movement at the hand.
Figure 5.5.2.3.2-2 Vibration Boundaries for ± 2 Minute Arc Visual Angle
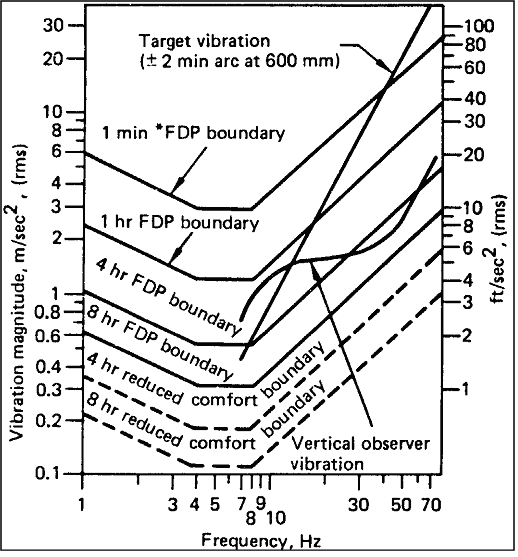
Note: * Fatigue Decreased Proficiency
|
Reference: 182, Figure 1, p. 4.109; NASA-STD-3000 140
Vibration transmitted to the hand-control interface may degrade system performance if the system responds at the frequency of the vibration; the vibration response of the body often results in greatest vibration at about 5 Hz.
Low-frequency oscillation of the body (Hz) can affect activities involving unsupported arm movements and tasks such as navigational plotting.
5.5.2.3.3 Discomfort/Annoyance Effects of Vibration
{A}
Excessive vibration can be unpleasant, painful, or even hazardous to health. In severe vibration environments, performance can be impaired because of pain or discomfort. Since vibration of aircraft and vehicles often increases with speed, maximum performance of crew may be limited.
Motion sickness is often caused by low-frequency (.63 Hz) vertical oscillation. The greatest sensitivity to vibration acceleration occurs at approximately 0.1 - 0.3 Hz. At these frequencies 1 m/sec2 rms may result in an incidence of vomiting of approximately 10%. (See
Figure 5.5.3.2.1-1.)
Correlation occurs between z-axis vertical rms acceleration magnitude, vomiting incidence, and illness. Correlation is highest with z-axis motion and is increased slightly when other axes are included in the analysis. The percentage of persons becoming motion sick increases as the exposure duration increases up to four hours.
The perception threshold for 2-100 Hz vibration is approximately 0.01 m/sec2 rms for most axes of whole-body vibration and most orientations of the body. At vibration magnitudes above threshold, the discomfort (i.e., subjective magnitude) increases in linear proportion to the vibration magnitude.
Exposure of the entire body or parts of the body (e.g., limbs) to high magnitudes of continuous vibration or shock can cause injury. The acceptable magnitude depends on several factors including the frequency, direction, duration, and point of contact with the body. General guidance is available but the probability of any specific injury due to given conditions cannot be calculated.
Crewmember discomfort is not quantified on an absolute scale. A scale of comfort reaction to whole body vibration is as follows:
a. Not Uncomfortable -
Gx less than 0.153 m/sec2
b. A Little Uncomfortable -
gx of 0.315 to 0.63 m/sec2
c. Fairly Uncomfortable -
gx of 0.5 to 1.0 m/sec2
d. Uncomfortable -
gx of 0.8 to 1.6 m/sec2
e. Very Uncomfortable -
gx of 1.25 to 2.5 m/sec2
f. Extremely Uncomfortable -
gx greater than 2.0 m/sec2
Figure 5.5.2.3.3-1 shows short-term vibration exposure boundaries as a function of acceleration and frequency from 1 Hz to 1000 Hz. Unless otherwise stated, the vibration boundaries are for exposure times of 5 to 20 minutes, which includes the spacecraft launch or entry phase.
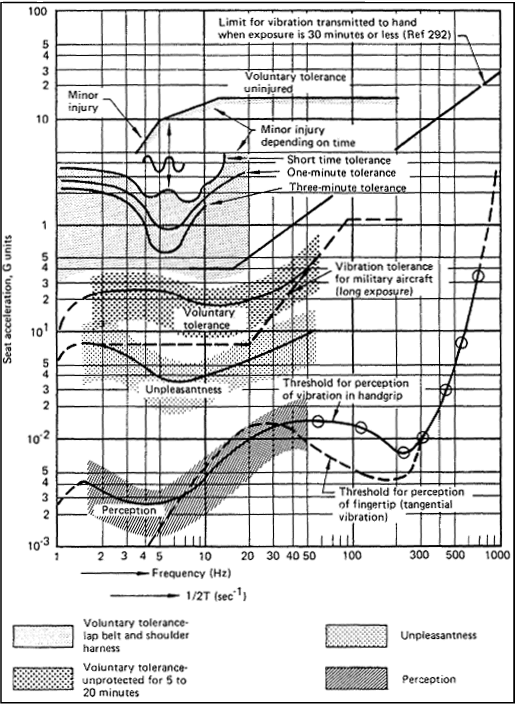
Reference: 5, Figure 72, p. 265; 292,
Figure 5.8, p. 93; NASA-STD-3000 142
Figure 5.5.2.3.3-2 lists some vibration discomfort symptoms and the range of frequencies of lowest tolerance.
Figure 5.5.2.3.3-2 Sensitive
Vibration Frequencies for Discomfort Symptoms
Sensitive Vibration Frequencies
| Symptom |
Frequency (Hz) |
Motion sickness |
0.1 - 0.63 |
| Abdominal pains |
3 - 10 |
| Chest pain |
3 - 9 |
| General discomfort |
1 - 50 |
| Complaints |
4 - 8 |
| Skeleto-muscular discomfort |
3 - 8 |
| Head symptoms |
13 - 20 |
| Lower jaw symptoms |
6 - 8 |
| Influence on speech |
13 - 20 |
| "Lump in throat" |
12 - 16 |
| Urge to urinate |
10 - 18 |
| Influence on breathing |
4 - 8 |
| Muscle contractions |
4 -9 |
| Testicular pain |
10 |
| Dyspnea |
1 - 4 |
Reference: 5, p. 266; 92,
p.237-239; 294 Table 1, p. 13;
NASA-STD-3000 143
5.5.2.4 Vibration Exposure Limits Design Considerations
{A}
5.5.2.4.1 Vibration Direction Criteria Design Considerations
{A}
Rectilinear vibrations transmitted to crewmembers should be measured in the appropriate directions of an orthogonal coordinate system having its origin at the heart. Limiting criteria exist for vibration accelerations in the x, y, and z-axis. (See
Figure 5.3.1-1.)
Angular (or rotational) vibrations about a center of rotation are frequently an important part of the vibration environment. However, little information on the effects of angular (or rotational) vibration is available.
5.5.2.4.2 Vibration Exposure Criteria Design Considerations (0.1 to 1 Hz)
{A}
The frequency range between 0.1 and 0.63 Hz is primarily associated with the symptoms of motion sickness: pallor and dizziness through nausea to vomiting and complete disability.
The decreased proficiency boundary is that limit of vibration acceleration where manual dexterity is impaired. The acceptable degree of impairment and corresponding acceleration levels will vary greatly with the nature of the task.
The reduced comfort boundary is that limit of vibration acceleration when the onset of various feelings of discomfort occurs.
5.5.2.4.3 Vibration Exposure Criteria Design Considerations (1 to 80 Hz)
{A}
The human body is especially sensitive to vibratory accelerations from 1 to 30 Hz. The three generally recognized limits for preserving comfort, working proficiency, and safety (or health) are called the reduced comfort boundary, the fatigue-decreased proficiency boundary, and the exposure limit, respectively.
Rectilinear vibration acceleration criteria exist from 1 Hz to 80 Hz. Rotational vibration standards have not been established.
a. Exposure Limit - The vibration acceleration exposure limit is set at approximately half the level considered to be the threshold of pain.
b. Fatigue-Decreased Proficiency Boundary - The vibration acceleration limit beyond which exposure can be regarded as carrying a significant risk of impaired working efficiency in many kinds of tasks is that in which fatigue is known to degrade performance. The fatigue-decreased proficiency boundary limit is a function of frequency and exposure time and is one-half (-6 dB) of the acceleration values given for the Exposure Limit.
c. Reduced Comfort Boundary - The vibration acceleration limit related to comfort and such activities as eating, reading, and writing. The reduced comfort boundary is one-third (-10 dB) of the value of the Fatigue-Decreased Proficiency Boundary.
5.5.2.4.4 Vibration Duration Criteria Design Considerations
{A}
Variations in the intensity of vibration and any intermittency or interruption of exposure which may occur during the period will have a cumulative effect on a crewmember's daily exposure.
a. Continuous Exposure - The tolerable acceleration level increases with decreasing exposure time. Vibration limits are established for durations of one minute to 24 hours.
b. Intermittent Exposure - If the exposure to vibration is interrupted by pauses during the working day, but the intensity of exposure remains the same, then the effective total daily exposure time is obtained by adding up the individual exposure times.
c. Equivalent Exposure Time - If the rms acceleration amplitude varies appreciably with time, or if the total daily exposure is composed of several individual exposure times, then an equivalent total exposure is determined.
5.5.3 Vibration Design Requirements
{A}
The basic environmental limitations and criteria that apply to the design of crew stations and other habitable compartment areas within space module are included herein. Included are the various vibration environmental parameters essential to crew safety and comfort during a complete mission. The vibratory environment of the space module shall be designed to protect the crewmembers and preserve their ability to perform their operational functions with proficiency throughout the total mission.
5.5.3.1 General Vibration Design Requirements
{A}
The following general vibration design criteria shall be observed:
a General Vibration Design - Vibration generation and penetration shall be controlled to the extent that vibration energy will not cause personnel injury, interfere with task performance, induce fatigue, or contribute to the degradation of overall man/machine effectiveness during manned periods.
b. Equipment Vibration -
1. All vibrating equipment shall be mounted and located to reduce vibration at crew stations.
2. System design shall include vibration control provisions.
3. Means shall be provided to facilitate periodic measurement of vibration levels to verify that exposure limits are not being exceeded.
c. Long Duration Vibrations - For vibration of duration longer than 8 hours in the 0.1 to 0.63 Hz band, or 24 hours in the 1 to 80 Hz band, the values at 8 hours and 24 hours, respectively, shall be applicable. Refer to
paragraphs 5.5.3.2.1 and 5.5.3.3.2.
5.5.3.2 Vibration Exposure (0.1 to 1 Hz) Design Requirements
{A}
5.5.3.2.1 Severe Discomfort Boundary
{A}
The following vibration acceleration limits for 0.1 to 0.63 Hz shall apply:
a. Longitudinal Vibration - Figure
5.5.3.2.1-1 acceleration limits shall not be exceeded for the corresponding periods of time in the z-axis at any crewmember station. If other modes of vibration exist, particularly pitch and roll, boundary accelerations shall be reduced by 25%. These criteria apply to 1-G bias conditions and on-orbit microgravity conditions.
b. Transverse Vibration - Use 30% of value for longitudinal vibration requirements.
c. Rotational Tolerance - Tumbling or rotational rates shall not exceed 60 rpm about the axis of the heart or 40 rpm about the axis of the hip. If rotational vibration exists, the levels in
Figure 5.5.3.2.1-1 shall be reduced by 33%
d. Launch Vibration Limits - During the launch phase, 0.1 - 0.63 Hz vibration shall not exceed 90% of those values stated for 1-G bias acceleration.
5.5.3.2.2 Decreased Proficiency Boundary
{A}
The following acceleration limits for 0.1 to 0.63 Hz for crewmember stations and work areas shall apply:
a. Longitudinal Vibration - Because of lack of data, the decreased proficiency boundaries below 1 Hz in the z-axis have yet to be specified for various tasks. For tasks requiring writing and fine manual control, vibration rms-values shall not exceed 1.75 m/sec2.
b. Transverse Vibration - Because of lack of data, the decreased proficiency boundaries below 1 Hz in the x, y-axis have yet to be specified.
c. Visual Acuity Effects - For whole body vibration in the ranges of 3 to 11 Hz or 22 to 30 Hz, provisions shall be made to protect the crew from loss of visual acuity.
Figure 5.5.3.2.1-1 Longitudinal (Z-Axis) Acceleration Limits (0.1 to 0.63 Hz) "Severe Discomfort Boundaries"
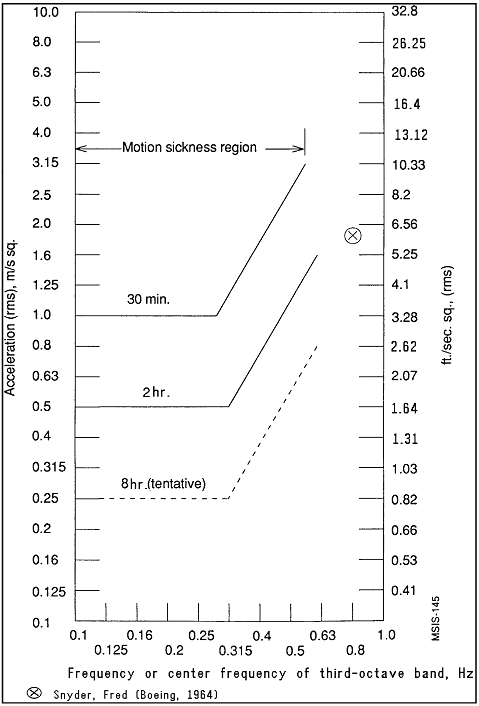
Note: Eight-hour curve created by exterpolation based on 30 min. and 2
hour testing.
|
Reference: 101, p. 44, add. 2-1982 E
with updates; NASA-STD-3000 145
5.5.3.2.3 Reduced Comfort Boundary
{A}
The following vibration acceleration limits for 0.1 to 1 Hz apply to rest and sleep areas:
a. Longitudinal Vibration - Because of lack of data and the variability of onset of various reduced comfort symptoms requirements are not specified at this time.
b. Transverse Vibration - Because of lack of data and the variability of onset of various reduced comfort symptoms, requirements are not specified at this time.
5.5.3.2.4 Vibration Duration
{A}
The following vibration duration criteria for determining effective daily exposure shall apply:
a. Whole Body z-axis Vibration (0.1 to 0.63 Hz) - Figure
5.5.3.2.1-1 shall be used to define the severe discomfort boundary for 0.5-, 2- and 8-hour exposures. The relationship a2t = constant and values in
Figure 5.5.3.3.2-1 shall be used if interpolation of summation of a varying acceleration time history is required.
b. Whole Body x, y-axis Vibration (0.1 to 0.63 Hz) - Because of lack of data, vibration requirements are not specified at this time.
c. Long Duration Vibrations - For vibration of duration longer than 8 hours in the .1 to .63 Hz band, the amplitude limits for 8 hours shall be applicable.
5.5.3.2.5 Vibration Data From 0.63 to 1.0 Hz.
{A}
With the exception of the one data point shown in Figure
5.5.3.2.1-1, values relative to vibration effects between 0.63 Hz and 1.0 H are undefined at this time.
5.5.3.3 Vibration Exposure (1 to 80 Hz) Design Requirements
{A}
5.5.3.3.1 Fatigue-Decreased Proficiency Boundary
{A}
The following vibration acceleration limits for 1 to 80 Hz for crewmember stations and work areas during orbital to planetary conditions shall apply:
Longitudinal Vibration - Vibration acceleration exposure shall not exceed the limits shown in
Figure 5.5.3.3.1-1 for z-axis direction, unless specified otherwise.
b. Transverse Vibration - Vibration acceleration exposure shall not exceed the limits shown in
Figure 5.5.3.3.1-2 for x, y-axis directions, unless specified otherwise.
c. Visual Acuity Effects - For whole body vibration in the ranges of 3 to 11 Hz or 22 to 30 Hz, provisions shall be made to protect the crew from loss of visual acuity.
Figure 5.5.3.3.1-1 Longitudinal (z-axis) Acceleration Limits "Fatigue-decreased Proficiency Boundary"
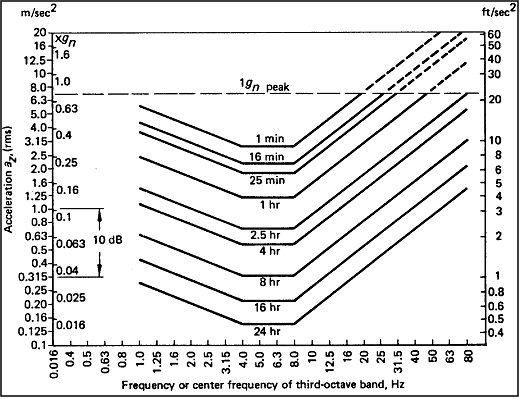
To obtain:
- "exposure limits": multiply acceleration values by 2 (6 dB
higher);
- "reduced comfort boundary": divide acceleration values by 3.15 (10
dB lower)
|
Reference: 2, Figure 42, p. 175; 101,
p. 10; NASA-STD-3000 146
Figure 5.5.3.3.1-2 Transverse (y-axis) Acceleration Limits "Fatigue-decreased Proficiency Boundary"
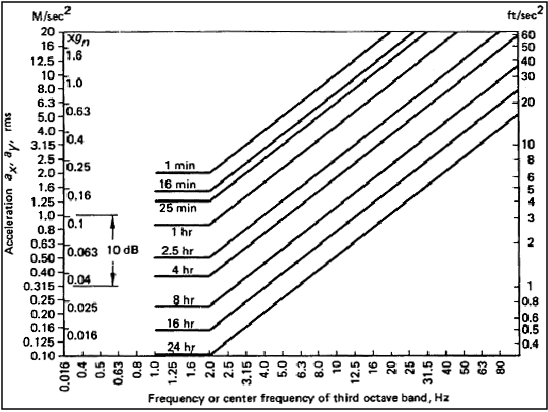
To obtain:
- "exposure limits": multiply acceleration values by 2 (6 dB
higher);
- "reduced comfort boundary": divide acceleration values by 3.15 (10
dB lower)
|
Reference: 2, Figure 42, p. 175; 101,
p 12; NASA-STD-3000 147
5.5.3.3.2 Vibration Exposure Limit
{A}
The following vibration acceleration limits for 1 to 80 Hz for crewmember 1-G and on-orbit stations shall apply:
a. Longitudinal Vibration - Vibration acceleration values in the z-axis shall not exceed the fatigue-decreased proficiency boundary
(Figure 5.5.3.3.1-1) by a factor of 2 (6 dB higher.).
b. Transverse Vibration - Vibration acceleration values in the x, y-axis shall not exceed the fatigue-decreased proficiency boundary
(Figure 5.5.3.3.1-2) by a factor of 2 (6 dB higher).
c. Launch Vibration Limits - During the launch phase it is permissible to use twice the safety factor of Figures
5.5.3.3.1-1 and 5.5.3.3.2-1 to determine the maximum vibration limits. However, if visual monitoring of critical displays is required, then the vibration criteria shown in Figure
5.5.3.3.2-1 shall be used for vibration frequencies up to 35 Hz. For visual acuity during launch the vibration limits shall not exceed those shown in Figure
5.5.3.3.2-1 (0-35 Hz) and Figure
5.5.3.3.2-2 (35-1000 Hz).
Figure 5.5.3.3.2-1 Tolerance Limits to Equivalent Sinusoidal Vibration (gx) for Visual Monitoring of Critical Displays During Launch
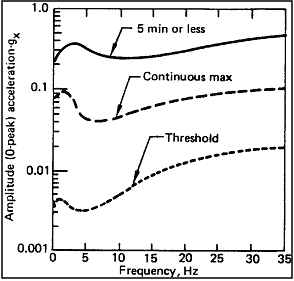
Reference: 198, p. 13; NASA-STD-3000 294
Figure 5.5.3.3.2-2 Maximum Tolerable Limits of Vibration (gx) for Visual Activity and Toggle Switch Manipulation During Launch
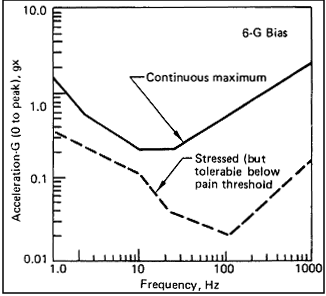
Reference: 198, p. 14; NASA-STD-3000 295
5.5.3.3.3 Reduced Comfort Boundary
{A}
The longitudinal vibration acceleration exposure for 1 to 80 Hz shall not exceed the limits shown in
Figure 5.5.3.3.3-1 for x, y-axis vibration in the crewmember rest and sleep areas during orbital or planetary conditions.
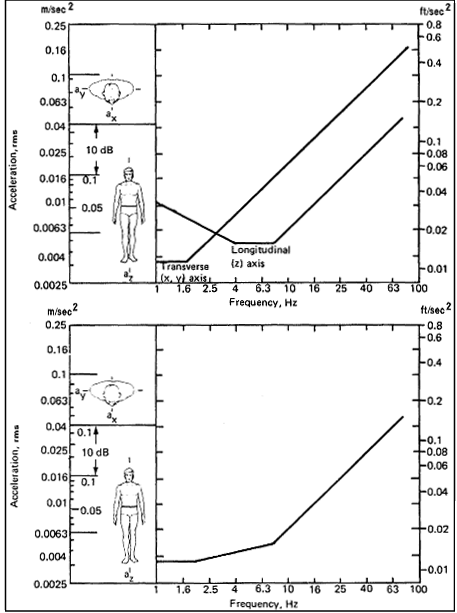
Note: Vibration exposure criteria for longitudinal and transverse (upper curve) and
combined (lower curve) directions with respect to body axis.
|
Reference: 2, Figure 44, p. 177; NASA-STD-3000 148
5.5.3.3.4 Vibration Duration
{A}
The following vibration duration criteria for determining effective exposure shall apply:
a. Whole Body z-axis Vibration (1 to 80 Hz) - Figure 5.5.3.3.4-1 shall be used to define the fatigue-decreased proficiency boundary for longitudinal vibration duration time between 1 minute and 24 hours.
b. Whole Body x, y-Axis Vibration (1 to 80 Hz) - Figure
5.5.3.3.4-2 shall be used to define the fatigue-decreased proficiency boundary for transverse vibration time between 1 minute and 24 hours.
c. Interrupted Vibration - If the exposure to vibration is interrupted by pauses during a 24-hour period, but the intensity of exposure remains the same, then the effective total daily exposure time shall be determined by adding up the individual exposure times.
d. Variable Amplitude Vibration - If the acceleration amplitude varies with time or if the total daily exposure is composed of several individual exposure times at different levels, then an equivalent total exposure shall be determined by the procedure given in Reference
101, p. 498.
e. Long Duration Vibrations - For vibration of duration longer than 24 hours in the 1 to 1000 Hz band, the amplitude limits for 24 hours shall be applicable.
Figure 5.5.3.3.4-1 Longitudinal (z-axis) Acceleration Limits "Fatigue-decreased Proficiency Boundary"
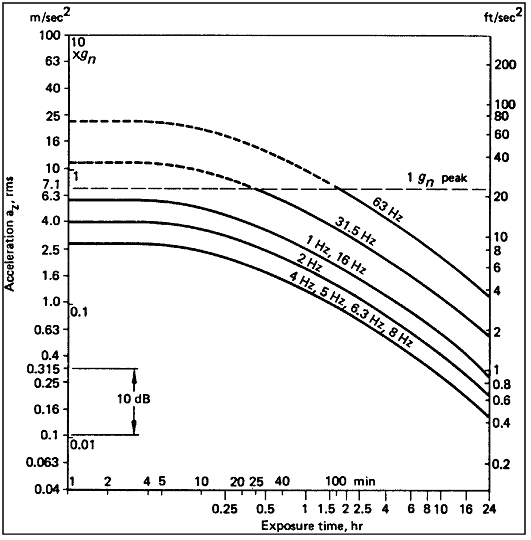
Reference: 101, p. 11; NASA-STD-3000 149
Figure 5.5.3.3.4-2 Transverse (x-axis, y-axis) Acceleration Limits "Fatigue-decreased Proficiency Boundary"
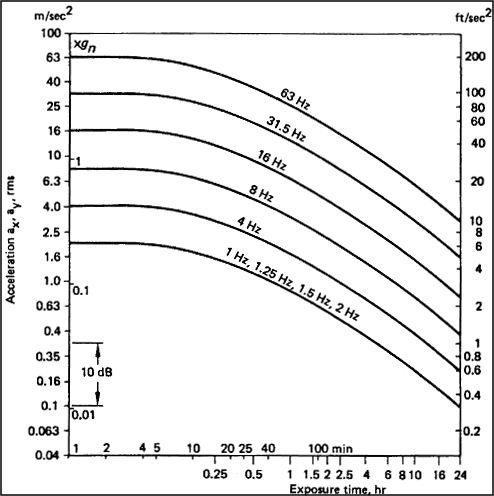
To obtain:
- "exposure limits": multiply acceleration values by 2 (6 dB
higher);
- "reduced comfort boundary": divide acceleration values by 3.15 (10
dB lower)
|
Reference: 101, p. 13; NASA-STD-3000 150
5.5.4 Example Vibration Design Solutions
{A}
The control of vibration involves three interdependent elements: 1) Vibration control at the source, 2) interruption or absorption along the transmission path, and 3) protection at the receiver.
Vibration control techniques that can be applied to space module are basically the same as used in industrial and building vibration control. The G-bias on equipment and structure may range from 0 to 20-G, which will affect space module component systems vibration characteristics.
5.5.4.1 Vibration Control at the Source
{A}
The design of space module/equipment and control of vibration is initially implemented by stating equipment procurement specifications and locating equipment remotely from crewmember work stations and rest/sleep areas. The sources of vibration are:
a. Torsional.
b. Bending.
c. Flex and plate-modes.
d. Translational, axial, or rigid-body.
e. Intermittent.
f. Random and miscellaneous
Figure 5.5.4.1-1 lists examples of sources of vibration.
Methods of controlling vibration of various sources are listed in
Figure 5.5.4.1-2.
Figure 5.5.4.1-1 Sources of Vibration
|
Torsional vibration
Reciprocating devices
Valves
Compressors
Pumps
Engines
Rotating devices
Electric motors
Fans
Turbines
Gears
Turntables
Bending vibration
Shafts in motors
Springs
Belts
Pipes
Flexural and plate-mode vibration
Hulls and decks
Turbine blades
Gears
Floors
Walls
Translational, axial, or rigid-body vibration
Reciprocating devices
Engines
Compressors
Shakers
Motors
Devices on vibration mounts
Intermittent vibration
Impacts on floor
Impacts on walls
Impacts on the hull
Typewriters
Stepping motors
Relays
Random and misc. vibration
Rocket combustion
Aerodynamic turbulence
Gas and fluid flow interacting in pipes and ducts
|
Reference: 295, Table 2-1, p. 11; NASA-STD-3000 151
Example vibration problem: Intense vibration at 11 Hz was experienced with the Titan II rocket engine. A similar problem was detected in an early Saturn V test. Fuel pump and engine phasing modifications reduced the vibration intensity to acceptable levels.
Figure 5.5.4.1-2 Vibration Control Methods at the Source
Gas or fluid flow vibrations
Reduce flow rate
Use less pressure
Use quieter valve
Modify impeller
Smooth pipe or duct
Lagging of pipe or
duct
Use flow turning vanes
at bends
Gear vibrations
Use proper lubrication
Reduce speed
Balance gear
Replace worn/damaged
gears
Use higher quality
gear
Use different material
gear
Rotate vibrations
Balance rotor/coupling
Modify force or speed
Alter rotor bearings
Add damping
Reduce mass of moving
elements
Bearing vibrations
Lubricate properly
Adjust bearing
alignment or mounting
Reduce speed
Replace worn or damage
bearings
Different bearing type
Magnetic vibration
Use quieter motor,
choke or transformer
Isolate or enclose
Relocate
Belt/chain vibration
Adjust tension
Adjust alignment
Lubricate properly
Reduce speed
Change material
or type
Pump noise
Reduce speed
Reduce pressure
Alter pressure cycle
Isolate
Combustion noise
Correctly adjust burner
Use lower pressure barrier
Impact vibration
Avoid it
Cushion it
Apply damping
|
Reference: 295, Table 16-2, pp. 241, 247-249; NASA-STD-3000 152
5.5.4.2 Control of Vibration - Path Transmission
{A}
Space module structure vibration can be excited mechanically or by airborne noise. Increasing the losses in the vibration transmission path is a common way to reduce vibration levels at the receiver.
Excitation of structures such as walls, floors, and ceilings can be reduced by noise control at the acoustic source or by applying acoustic absorption and damping material at the excited structure.
Mechanically coupled transmission can be controlled by interrupting the transmission path to the receiver or introducing attenuating element couplings between the source and the receiver.
Figure 5.5.4.2-1 lists common ways to reduce vibration path efficiency.
Vibrating wall, floor and frames
Reduce area
Add mass
Change stiffness
Detune resonances
Add damping material
Gas of fluid flow vibrations
Use resilient pipe/duct connectors
Use resilient pipe hangers and supports
Equipment mount vibrations
Isolate sections with soft mounts
Fasten external parts at vibration nodes
Detune-avoid resonant buildup
Source/receiver locations
Position source or receiver at vibration nodes
Change position of source or receiver or both
Increase distance between source and receiver
|
Reference: 295, p. 242; NASA-STD-3000
153
5.5.4.3 Vibration Protection
{A
Protection of crewmembers from vibration problems is best served by controlling vibration at the source or along the transmission path. Residual over-limit vibrations at crewmember stations requires special attention to body posture and support
a. Body Posture - The semi-supine position is generally considered best for severe vibration in x, y, or z-axis, especially under high G-bias loads; i.e., launch, reentry, etc. The seated position is worse for z-axis vibration. The standing position is worse for x, y-axis vibration.
b. Crewmember Supports - The resonant frequency of crewmember supports should be one-half of the lowest vibration frequency of significance. Supports that can offer vibration protection are:
1. Contoured seats.
2. Contoured and adjustable couches.
3. Elastic seat cushions.
4. Suspension seats.
5. Body restraints.
6. Rigid or semirigid body enclosures.
7. Head restraints.
8. Vibration absorbent hand/foot pads.
Positioning crewmember stations on structure nodal points can alleviate demands on crewmember body support systems.
5.6 (THIS PARAGRAPH WAS NOT USED)
{A}
5.7 RADIATION
{A}
5.7.1 Introduction
{A }
Crewmembers in a space module will be exposed to both ionizing and non-ionizing radiation. Ionizing radiation, which breaks chemical bonds in biological systems, can have immediate (acute) as well as latent effects, depending on the magnitude of the radiation dose absorbed, the species of ionizing radiation, and the tissue affected. Non-ionizing radiation (consisting of different types of electromagnetic radiation) are generally not energetic enough to break molecular bonds in biological systems but, with sufficient intensity, can produce adverse biological effects. Ionizing radiation, which is discussed in
Paragraph 5.7.2 is attributable mainly to natural, rather than manmade, sources in space. Non-ionizing radiation, which is discussed in
Paragraph 5.7.3, is attributable primarily to manmade sources within the spacecraft.
5.7.2 Ionizing Radiation
{A}
5.7.2.1 Ionizing Radiation Design Considerations
{A}
5.7.2.1.1 Types of Ionizing Radiation
{A}
The ionizing radiation in space is comprised of charged particles, uncharged particles, and high-energy electromagnetic radiation. The particles vary in size from electrons (beta rays) through protons (hydrogen nuclei) and helium atoms (alpha particles) to the heavier nuclei encountered in cosmic rays, e.g., HZE particles (High Z and Energy, where Z is the charge). They may have single charges, either positive (protons, p) or negative (electrons, e), multiple charges (alpha or HZE particles); or no charge, such as neutrons. The atomic nuclei of cosmic rays, HZE particles, are usually completely stripped of electrons and thus have a positive charge equal to their atomic number.
The ionizing electromagnetic radiation consists of x-rays and gamma-rays which differ from each other in their energy. By convention X-rays have a lower energy than the gamma-rays with the dividing line being at about 1Merv. In general, x-rays are produced either by the interaction of energetic electrons with inner shell electrons of heavier elements or through the bremsstrahlung or braking radiation mechanism when deflected by the Coulomb field of the atomic nuclei of the target material. Gamma-rays are usually products of the de-excitation of excited heavier elements.
Ionizing radiations vary greatly in energy. Electromagnetic radiations have energy quanta determined by their wavelength or frequency. The energy of particulate radiation depends on the mass and velocity of the particles.
Figure 5.7.2.1.1-1 summarizes the main types of ionizing radiation including their charge, mass, and source.
Figure 5.7.2.1.1-1 Sources and Characteristics of Electromagnetic and Particulate Ionizing Radiations in Space.
| Name |
Nature of radiation |
Charge |
Mass |
Sources |
| X-ray |
Electromagnetic |
0 |
0 |
Primary: Solar corona, stars, galaxies,
terrestrial atmosphere in auroral zone.
Secondary: Spacecraft structure in some parts of the radiation belts,
in the auroral zone, and in interplanetary space following some solar
flares
|
| Gamma ray |
Electromagnetic |
0 |
0 |
Stars, galaxies, unknown sporadic sources, and
spacecraft atmosphere. |
| Electron |
Particle |
-e |
1me |
Radiation belts and auroral regions. |
| Proton |
Particle |
+e |
1840 me or 1 amu |
Galaxy cosmic rays, radiation belts, and solar
flares. |
| Neutron |
Particle |
0 |
1841 me |
Primary: Galactic cosmic ray atmosphere albedo
neutrons.
Secondary: Galactic cosmic ray interaction with spacecraft structure.
|
| Alpha particle (helium nucleus) |
Particle |
+2e |
4 amu |
Galactic and solar. |
| HZE particle (heavy primary nuclei) |
Particle |
=> +3e |
=> 6 amu |
Galactic and solar. |
Reference: 19, Subnote 1 (1); NASA-STD-3000 154
5.7.2.1.2 Sources of Ionizing Radiation
{A}
Man in a space module will be subject to radiation emanating from two different kinds of sources: those occurring naturally in space and manmade sources. The naturally occurring space radiation environment is comprised of charged particles (and accompanying electromagnetic radiation) attributable to a number of distinct sources as shown in
Figure 5.7.2.1.2-1. In terms of potential biological hazard, some of these sources produce particles that can be neglected because either the particle energy or flux density is too low. Thus, from a practical standpoint the radiation encountered in space may be attributed to three principal sources: geomagnetically trapped radiation, galactic cosmic radiation, and solar particle event radiation (also called solar cosmic rays). The galactic cosmic radiation is biologically important despite its lower density. Space radiation levels vary substantially both with time and with distance from the Earth. These temporal and spatial fluctuations must be taken into account in the planning of space missions if radiation exposures are to be held to an acceptable level. The three main sources of space radiation will be discussed separately.
For planning purposes the low inclination, low altitude earth orbit (LEO), the low altitude polar orbit (LPO), and the interplanetary orbit (IO) are representative of almost all future manned missions. Each of these orbits will be subject to a unique radiation environment. For the LEO one needs to consider only the lower edge of the radiation belt at the South Atlantic Anomaly (SAA), and galactic cosmic rays with energies above about 1 GeV. Since a spacecraft in LPO spends part of its time over the polar caps where the Earth's magnetic field is directly connected to the interplanetary magnetic field, its radiation environment will consist of about 60% SAA radiation and 40% galactic and solar cosmic rays. However, since a spacecraft in the low Earth orbit flies quite close to the Earth, the Earth acts as a large shield, protecting it additionally from solar flare and galactic radiation over roughly 2 pi steradians. In interplanetary space, on the other hand, any space craft will be exposed to both solar and galactic cosmic ray radiation over the full 4 pi steradian solid angle.
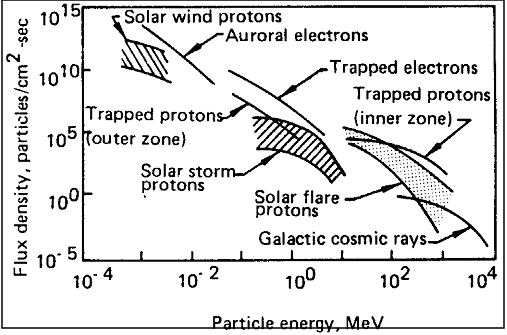
Reference: 179, p. 34; NASA-STD-3000 154
5.7.2.1.2.1 Trapped Radiation Belts
{A}
If only electrons are considered, there are two belts of geomagnetically trapped radiation around the Earth. These belts, known as the Van Allen belts, are separated by a region of relatively low intensity. The inner belt consists of and high energy electrons, extends out to an altitude of approximately 12,000 km (6500 nm) and peaks at altitudes ranging from roughly 2000 - 5000 km (1100 - 2700 nm) depending on such factors as particle type (e or p), particle energy, solar cycle condition, shield thickness, etc. depending on such factors as electron energy, solar cycle conditions, shield thickness, etc.
Protons, on the other hand, form one uniform trapping region whose lower boundary is the earth's atmosphere at about 500 m while the outer boundary is the magnetopause between 36000 km and 67000 km. In this region the distance of the peak flux depends on the energy of the particles with the energetic protons peaking closer to the earth, while the low energy protons peak at the position of the electron slot. Within a distance of about 20000 km the Earth's magnetic field governing the dynamics of the radiation belts is mainly dipolar with smaller contributions from higher order terms. However, the dipole is also offset from the center of radiation belts come closest to the surface of the Earth at the location of the South Atlantic Anomaly (SAA) whose center lies roughly at 35 degrees east longitude and 35 degrees south latitude (see
Figure 5.7.2.1.2.1-1). In this region, for a given altitude, the proton intensity exceeds the intensity measured at the same altitude at any other part of the globe. For trajectories of space vehicles of 30 degrees inclination from the equator or greater, there will be approximately five traverses through this SAA each day (see
Figure 5.7.2.1.2.1-2). Experience with Earth orbital missions to date indicates that nearly all of the accumulated radiation exposure can be attributable to passage through the SAA.
The proton spectra and fluence are strong functions of altitude. At the higher altitudes, the greater portion of crew exposures is received during transits through the SAA as a result of greater trapped proton fluence levels. At lower altitudes, the protons in the SAA interact with the residual atmosphere. Some of the protons are lost and contribute to an anisotropic distribution of protons. Over a factor of two difference exists between the proton flux from the east compared to the flux from the west. The anisotrophy in particle flux will be an important factor for Space Station.
In addition to altitude, the integrated dose is a function of orbital inclination and solar cycle. Increases in solar activity expand the atmosphere and increase the losses of protons in LEO. Therefore, trapped radiation doses in LEO decrease during solar maximum and increase during solar minimum.
Trajectories of low inclination flights do not pass the regions of maximum intensities within the SAA. Although high inclination flights pass through the SAA maximum intensity regions, less time is spent in the SAA than low inclination flights. Thus crews in high inclination flights receive less net exposure to trapped radiation than in low inclination flights for a given altitude.
Figure 5.7.2.1.2.1-1 depicts the location of the SAA. Low inclination flights will not transit the SAA south of 28.5 degrees south latitude and avoids the peak of the SAA. High inclination flights transit between North and South 58 degrees.
Figure 5.7.2.1.2.1-1 Trapped Radiation Belt Flux In the South Atlantic Anomaly for Protons of Energy Greater Than 30 MeV Projected for STS-61, Hubble Repair Mission.
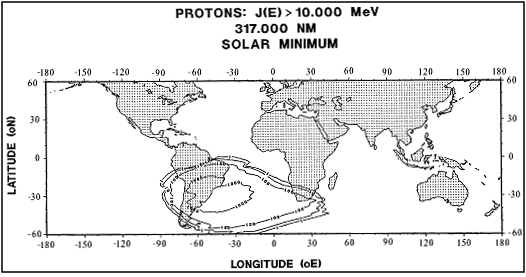
Reference: 411; NASA-STD-3000 411
Figure 5.7.2.1.2.1-2 Variation of Dose-Rate Within A Low Earth Orbiting Spacecraft (28.5° inclination, 333 nautical Miles)
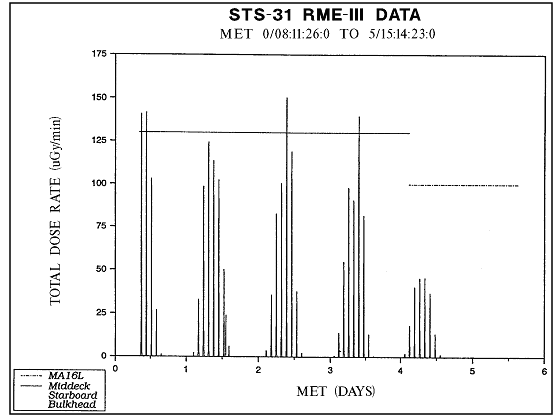
Reference: 328, Figure 2; 411;
NASA-STD-3000 512
5.7.2.1.2.2 Galactic Cosmic Radiation
{A}
Galactic Cosmic Radiation (GCR), frequently referred to simply as galactic radiation, originates outside the solar system. This radiation consists of atomic nuclei that have been ionized and accelerated to very high energies. Protons (hydrogen nuclei) constitute about 85% of this radiation; alpha particles (helium nuclei), about 13%; and heavier nuclei (HZE particles) from Z = 3 to approximately 30, the remaining few percent. (For specific tabulations of the major nuclei comprising the galactic cosmic rays see Reference
209). Actually, nuclei with atomic number Z greater than 30, the so-called ultra heavy nuclei, are also present, but at extremely low levels (their combined abundance is only about 10-4 of that of iron).
A distinction also exists between true galactic cosmic radiation originating from a cosmic ray source (CRS) outside the solar system and a component that seems to be part of the solar system and which has a much smaller HZE contribution.
The galactic cosmic radiation received on Earth varies substantially both as a function of the level of solar activity occurring at that time and as a function of position on the Earth's surface.
Figure 5.7.2.1.2.2-1 shows the fluxes of different GCR components as a function of position on the Earth (geomagnetic latitude zero deg is equatorial, 90 deg is polar). The increase in the proton and alpha particle fluxes during the time of decreased solar activity (solar minimum) as compared to time of increased solar activity (solar maximum) is clearly shown.
For spacecraft, both the altitude of the vehicle and the inclination of the orbit are important in determining the radiation dose rate that would be received due to the GCR, as shown in
Figures 5.7.2.1.2.2-2 and 5.7.2.1.2.2-3. Two figures are shown, one depicting the dose rate (in rads) to the crewmembers, and the other, the dose equivalent rate in rem, which is discussed in
5.7.2.1.3. The major effect, shown in the figures, is the shielding afforded by the Earth's magnetic field in deflecting the incoming charged particles of the GCR. For space modules in LEO, the 300 km (160 nm) orbit curves are applicable. At an altitude of about six Earth radii (approximately geosynchronous orbit) this geomagnetic shielding effect disappears.
Figure 5.7.2.1.2.2-1 Intensity of the Various Primary Components of the GCR Radiation as a Function of Geomagnetic Latitude
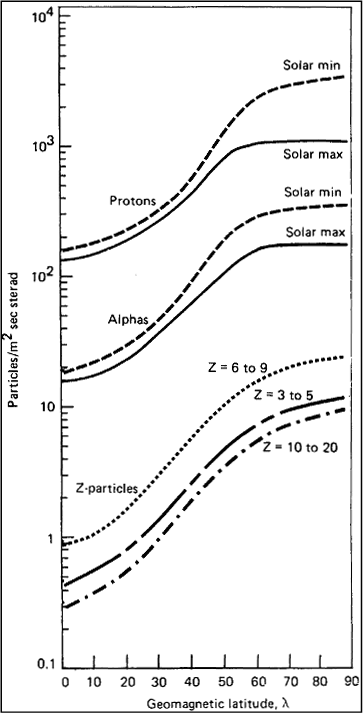
Reference: 78, p. 2-119; NASA-STD-3000 158
Figure 5.7.2.1.2.2-2 Galactic Cosmic Ray Dose Rate in Rads as a Function of Orbit Altitude and Inclination.
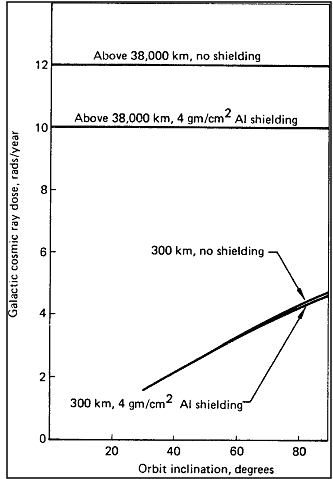
Reference: 330, Figure 11; NASA-STD-3000 159
Figure 5.7.2.1.2.2-3 Galactic Cosmic Ray Dose Equivalent Rate in Rads as a Function of Orbit Altitude and Inclination.
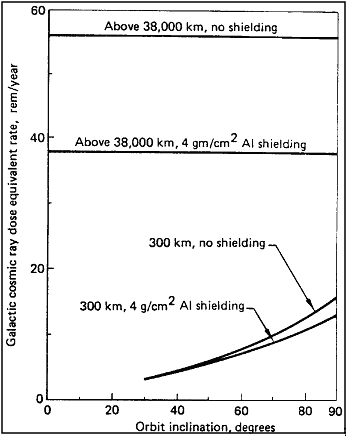
Reference: 330, Figure 11; NASA-STD-3000 160
{A}
Solar activity increases in rather regular 11-year cycles and is characterized by giant eruptions from the surface of the Sun termed solar flares. Solar flares develop rapidly and generally last only 30 to 50 minutes, during which time intense electromagnetic radiation is emitted, along with energetic particles. However, the solar particles continue to arrive near the Earth for a few hours to several days after the visible activity has ceased. Only a fraction of the solar flares produce particles that reach the near-Earth vicinity.
These high-energy particles, consisting primarily of protons but also of alpha and HZE particles, are called solar cosmic radiation (SCR). Alternate terms used are solar energetic particles (SEP) and solar proton event (SPE) radiation. (Specific tabulations of the major nuclei comprising the SCR can be found in References
210 and 211.) A comparison between the GCR and SCR is shown in
Figure 5.7.2.1.2.3-1.
The 11-year cycle of solar activity was first noted by 19th century astronomers on the basis of sunspots, and refined by them by reconstructing sunspot data back to the year 1749.
Figure 5.7.2.1.2.3-1 Comparison of Galactic Cosmic Rays and Flare Produced Solar Cosmic Rays
Galactic Cosmic Rays and Flare Produced Solar Cosmic Rays
| CRITERION |
GALACTIC COSMIC |
SOLAR COSMIC RAYS |
Spatial distribution |
Isotropic beyond terrestrial influence (no preferred direction of
arrival). |
Nonisotropic at onset, later becoming diffused through solar system. |
Composition |
Approximately 85% proton, 13% alpha particles, remainder heavier nuclei,
primarily of elements Z <or= 26, very small fraction 30<or= Z <or=
92 |
Almost all (96-99%) protons, some (1-4%) alpha particles, small, remainder
(0.01-0.1%) heavier nuclei of elements Z <or= 26 |
Temporal variations |
Permanent phenomenon, practically constant with time |
Transient radiation, greatly variable with time |
Energy |
Extending to at least 1017 ev in some cases (much greater
maximum than solar particles) |
About 1010 ev highest recorded |
Origin |
Theories only; perhaps supernovae explosions in the galaxy |
Active regions of flares on the sun |
Flux density |
Relatively low: about 2 particles/cm2 ×sec of all energies |
Very high: may be as high as 106 particles/cm2.sec |
Biological effects |
Primarily mutagenic with some vital cell destruction |
Primarily acute damages; possible sudden illness, incapacitation,
or death. |
Reference: 78, p. 2-113; 210, Table 1, NASA-STD-3000161
Figure 5.7.2.1.2.3-2 Solar Activity and Solar Proton Events for Cycles 19, 20, 21
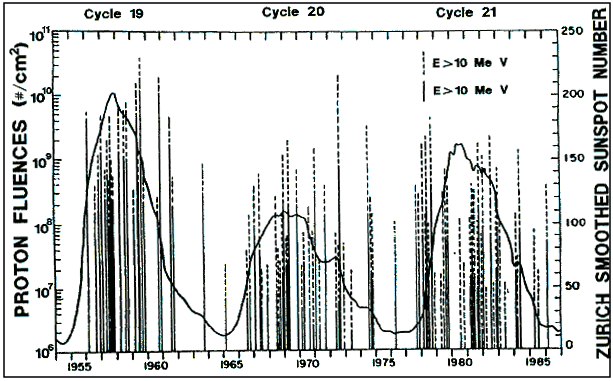
Reference: 411; 413;
NASA-STD-3000 521
However, data on solar cosmic rays have only been collected since 1956, which corresponds to the beginning of cycle 19. Data indicates that about 30 to 50 major SCR events occur per cycle, most during the middle 5 years corresponding to solar maximum . This is illustrated in
Figure 5.7.2.1.2.3-2 which displays integral solar proton fluence for the SCR events and the sunspot number for cycles 19 through 21.
Figure 5.7.2.1.2.3-3 depicts solar proton events from 1956 through mid 1992. Several large events occurred at the beginning of cycle 22.
a. Cycle 19 was the most active cycle in terms of both SCR particle fluencies and sunspot number. A tabulation of the 16 largest flare-produced events of the cycle is shown in
Figure 5.7.2.1.2.3-3 along with the calculated skin doses that these solar proton fluencies would produce.
b. The August 1972 event was the largest single recorded event, occurring during the more ordinary cycle 20. A plot of the calculated organ doses that these solar protons would have produced through l gm/cm2 (2 lb/ft2) of shielding in free space is shown in
Figure 5.7.2.1.2.3-4.
c. Cycle 21 appears to be more like cycle 19 than cycle 20, but produced neither the largest single event nor the highest cumulative proton fluency. Rather there are indications that the proton fluency over this cycle had a higher energy spectrum than during the two previous cycles.
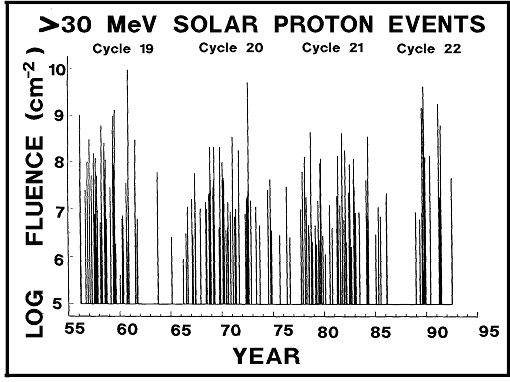
Reference: 412; NASA-STD-3000 522
Figure 5.7.2.1.2.3-4 Calculated Organ Doses from the August 1972 Solar Flare
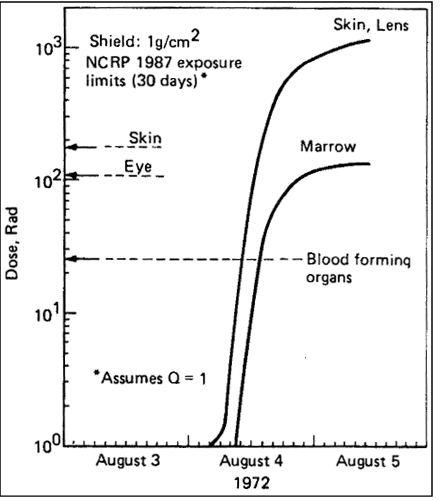
Reference: 179, Figure 16, p. 57; NASA-STD-3000 164
5.7.2.1.2.4 Onboard Radiation Sources
{A}
Manmade radiation sources onboard space modules can be put into three main categories: electric power sources, small radiation sources, and induced radioactivity.
The electric power sources may be further categorized as either a radioisotopic source or a nuclear reactor, both favored because of their compact size, light weight, and long life. The most common isotopic power source is the radioisotopic thermoelectric generator (RTG), a static device that directly converts the heat given off by an isotope to electricity via a thermocouple junction. Most of the nuclear power sources that have been launched by the U.S. are RTGs, ranging from the first one, SNAP-3A, in 1961 to the multi-hundred watt RTGs on the Voyager spacecraft in 1977. The dynamic isotope power system (DIPS) is another radioisotopic power system that was developed but not flown.
Nuclear reactors can provide large quantities of power more efficiently than RTGs. A single reactor was launched, the 500 W SNAP-10A in 1965, but programs in the 1980s, such as SP-100, have shown renewed interest in reactors, especially as power sources for hundreds, or even thousands, of kilowatts. Such reactors will be highly radioactive during and after operation and require substantial shielding. For space modules such as a space station, they can be incorporated into the overall configuration in one of three general ways: rigidly attached reactors (onboard or boom-mounted), flexibly attached reactors (tethered), and free-flying reactors.
Other radiation sources onboard would be very small in comparison to an RTG or a reactor (in size and radioactivity) and would be easily shielded. Such sources might include calibration sources (for radiation monitoring instruments), machine and isotopic radiography sources, ionization sources (for smoke detectors), radiopharmaceuticals, and scientific and medical radioisotopes used in experiments.
The third category, induced radioactivity, refers to the fact that some materials in a spacecraft may become radioactive as a result of interactions with space radiation. An example is the activation by protons (inner trapped belts, galactic cosmic radiation, solar flares) of aluminum, composed of the stable isotope A1-27, to the radioactive isotope Na22. The aforementioned space proton fluxes are generally low enough that the induced radioactivity does not present a radiation problem.
5.7.2.1.3 Human Responses to Ionizing Radiation
{A }
Manned space flight requires consideration of the biological effects of radiation on man. Biological effects are categorized as either latent (delayed effects due to low doses acquired over long periods) or acute (immediate effects from high doses acquired over short periods). Each of these are discussed below after the following paragraph, which describes the units of measure used to describe biological damage by ionizing radiation.
5.7.2.1.3.1 Units of Measure Used to Describe Human Responses to IO
{A}
a. Dose (D) - The amount of radiation energy absorbed by tissue is measured in rads (100 ergs of energy per gram of material). The currently used SI unit for dose is the gray (Gy), which is defined as 1 Gy = 100 rads.
b. Dose Equivalent (DE) - The amount of biologically damaging ionizing radiation is measured in terms of rem (roentgen equivalent man). It is defined as the product of the absorbed dose (D), in rad, and the quality factor (Q).
DE = D (Q)
The currently used SI unit for dose equivalent is the sieviert (Sv), which is defined as 1 Sv = 100 rem and equals dose in Gy times Q.
c. Quality Factor (Q) - The quality factor is an artificial factor dependent on the linear energy transfer of the radiation by means of which biological effects resulting from absorbed doses of different types of radiation may be related to X- and gamma-radiation doses.
Figure 5.7.2.1.3.1-1 presents current Q factors for a number of different types of radiation.
Figure 5.7.2.1.3.1-1 Quality Factor for Various Types of Radiation
Quality Factors
| Type of radiation |
Quality factor, Q |
|---|
|
X-rays
|
1
|
|
Gamma rays and bremsstrahlung
|
1 |
|
Beta particles, electrons, 1.0 MeV
|
1 |
|
Beta particles, 1.0 MeV
|
1 |
|
|
|
|
Neutrons, thermal energy
|
2.8 |
|
Neutrons, 0.0001 MeV
|
2.2 |
|
Neutrons, 0.005 MeV
|
2.4 |
| Neutrons, 0.02 MeV |
5 |
| Neutrons, 0.5 MeV |
10.2 |
| Neutrons, 1.0 MeV |
10.5 |
| Neutrons, 10.0 MeV |
6.4 |
|
|
| Protons, greater than 100 MeV |
1-2 |
| Protons, 1.0 MeV
|
8.5 |
| Protons, 0.1 MeV |
10 |
|
|
| Alpha particles (helium nuclei), 5 MeV |
15 |
| Alpha particles, 1 MeV |
20 |
Reference: 92, Table 9-1; NASA-STD-3000 165
As a given particle degrades in tissue, the Q will rise as its energy transfer per micrometer (see definition of LET below) rises. For a beam of protons having a wide range of energies, the average Q tends to drop with increasing depth in tissue as the lower energy component tends to be removed with increasing depth and the high-energy component continues its traversal.
The standard Q values are based on the most detrimental chronic biological effect (e.g., carcinogenesis by neutrons) for continuous low-dose exposure that might be met in industrial situations. However, the Q for many acute high dose rate exposures may be very much lower.
For this reason, recognized committees of radiation experts are currently reevaluating the data upon which the Q values are based and are likely to revise these Q factors.
d. Relative Biological Effectiveness (RBE) - A related but distinctly different term from Q, is the RBE, (relative biological effectiveness) which is based solely on experimentally determined effects of different types of radiation on biological systems.
e. Linear Energy Transfer (LET) - The LET denotes the rate of energy dissipation along the path of a charged particle. There are actually three LET equivalent terms in use:
1. LET in units of kev/micron (kev per micrometer of tissue).
2. dE/dx in units of Mev/cm, and therefore dE divided by dx = 10 LET.
3. dE/dz, in units of Mev cm2/gm of tissue, which is dE/dx divided by the density of the tissue.
The dependence of Q on the LET is seen in Figure
5.7.2.1.3.1-2.
For a beam of charged particles, the dose at a point in a medium is proportional to the fluency of particles at the point multiplied by the linear energy transfer (LET) divided by the density of the medium.
Figure 5.7.2.1.3.1-2 Values of Quality Factor as a Function of radiation LET, L, expressed in kev/mm
| Unrestricted linear energy Transfer,
L in water(kev/mm) |
Quality Factor Q(L) |
| < 10 |
1 |
| 10-100 |
0.32L -2.2 |
| >100 |
300/ vL |
Reference: 329, Fig.1, p.26; NASA-STD-3000 516-
5.7.2.1.3.2 Late Effects of Ionizing Radiation
{A}
In the beginning of the manned space program, the focus had been on acute, nonstochastic effects (direct tissue damage) of ionizing radiation on specific organs. More recently, much attention is being paid to the latent, stochastic effects (cancer and genetic effects) of low-level doses. The current limits are based on recommendations for Scientific Committee 75 of the National Council on Radiation Protection and Measurements (NCRP) that were outlined in their Report 98, Guidance on Radiation Received in Space Activities, July 31, 1989.
The crewmember career limit is based on the delivered dose equivalent to three body organs: eye (3 mm depth) skin (0.1 mm depth) and blood forming organs (BFO, 5 cm depth). The career depth dose - equivalent limit is based upon a maximum 3 percent lifetime excess risk of cancer mortality. The total dose-equivalent yielding this risk depends on sex and age at start of exposure. The career dose-equivalent limit is approximately equal to:
200 + 7.5 (age - 30) rem for males up to 400 rem maximum
200 + 7.5 (age - 38) rem for females up to 400 rem maximum
The recent recommendations incorporated a new philosophy to consider the age and sex of the individual being exposed. This was in recognition that organ radiosensitivities vary with an individual's age. Therefore, it is necessary to couple the exposure received with the organ radiosensitivities of the individual at that point in their lifetime to determine the actual risk incurred. Likewise, the sex of the exposed individual must be considered since radiosensitivities vary by sex.
The difference between male and female career limits represents the difference in radiosensitivities between the genders. Each career limit provides the same level of risk protection to both genders,i.e. 3% excess lifetime cancer mortality risk.
Previous career limits were based on earlier data from the atomic bomb survivors database that estimated the mortality risk of 6 × 10⁻⁵ mortality/rem. The basis of the current career limits places the risk on the order of 2 × 10⁻⁴ mortality/rem. The risk for genetic risk is estimated to be approximately half, 1 × 10⁻⁴ defects/rem. A more complete analysis of these risk factors may be found in NCRP Report 98.
Since Report 98 was compiled and issued, more data from the atomic bomb survivors has become available. Preliminary analysis indicates that lifetime mortality risk factors are greater than those used to develop the recommendations presented in NCRP Report 98. Lower career limits are likely to be recommended in the near future as this data is analyzed by NCRP Scientific Committee 75.
5.7.2.1.3.3 Acute Effects of Ionizing Radiation
{A}
Because of the possibility of high radiation doses to crewmembers due to unpredictable events (e.g., solar flares, emergency repairs on nuclear power sources, etc.), the effects of acute radiation doses will be discussed in some detail. This extends all the way to lethal doses, commonly expressed as **LD50** i.e., the radiation dose that is expected to kill 50% of an exposed population.
Despite the excellent record of very low crewmember doses to date, consideration of acute doses is also important because future space programs will involve much longer stays and orbits higher into the trapped belts. Aside from 2-8 rem on the long-duration Skylab missions, crewmember dose equivalents have been very much less than 1 rem. The strong dependence of crewmember dose with orbit altitude can be seen in
Figures 5.7.2.1.3.3-1 and 5.7.2.1.3.3-2. These plots depict actual crew dose rates in the crew compartment of the space shuttle for different inclinations as a function of mission altitude. Also shown in the figures are the results of corresponding calculations that used the AP8 trapped-belt proton environment model.
In the following paragraphs, acute whole-body irradiation effects, effects on specific organs, and performance degradation effects are discussed:
Figure 5.7.2.1.3.3-1 Measured Daily Absorbed Dose Rates Inside Shuttle Crew Compartment (DLOC 2 - Dosimeter Location 2)
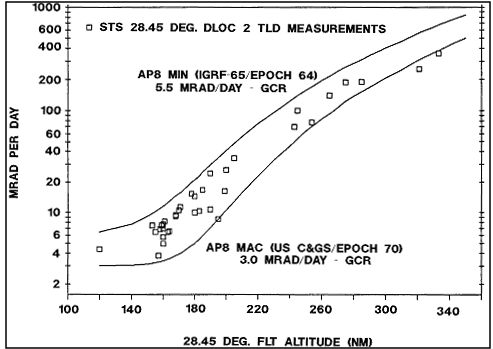
Reference: 374; 411;
NASA-STD-3000 510
Figure 5.7.2.1.3.3-2 High Inclination Orbits Compared With Calculated Values (AP8 Model) for Solar Min and Solar Max
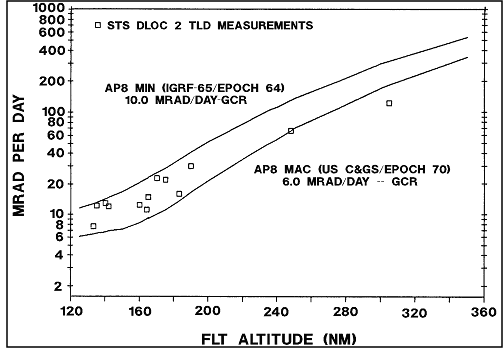
Reference: 374; 411;
NASA-STD-3000 509
5.7.2.1.3.3.1 Whole-Body Irradiation Effects
{A}
Figure 5.7.2.1.3.3.1-1 presents the expected early effects of acute whole-body irradiation. It should be emphasized that these thresholds do not hold true for partial body and protracted radiation of the same total dosage. They do not cover exposure to simultaneous environmental stress of other types. The latency periods and relative duration of symptoms are dependent upon the penetration, quality factors, total dose, dose distribution, and intensity of the exposure.
Figure 5.7.2.1.3.3.1-2 represents the mean survival time of man versus the acute radiation dose of whole-body radiation. The major cause of death is indicated for each dose range.
Figure 5.7.2.1.3.3.1-1 Expected Early Effects From Acute Whole Body Radiation on Earth
| Dose in rads |
Probable effect |
|
0 to 50 |
No obvious effect, except, possibly, minor blood changes and anorexia. |
|
50 to 100 |
Vomiting and nausea for about 1 day in 10 to 20% of exposed personnel.
Fatigue, but no serious disability. Transient reduction in lymphocytes
and neutrophils. |
|
100 to 200 |
Vomiting and nausea for about 1 day, followed by other symptoms of
radiation sickness in up to 50% of personnel; < 5% deaths anticipated.
A reduction of approximately 50% in lymphocytes and neutrophils will occur. |
200 to 350 |
Vomiting and nausea in 50 to 90% or personnel of first day, followed
by other symptoms of radiation sickness, e.g., loss of appetite, diarrhea,
minor hemorrhage; 5 to 90% deaths within 2 to 6 weeks after exposure;
survivors convalescent for about 3 months. |
350 to 550 |
Vomiting and nausea in most personnel on firs day, followed by other
symptoms of radiation sickness, e.g., fever, hemorrhage, diarrhea, emaciation.
Over 90% deaths within 1 month; survivors convalescent for about 6 months. |
550 to 750 |
Vomiting and nausea, or at least nausea, in all personnel within four
hours from exposure, followed by severe symptoms of radiation sickness,
as above. Up to 100% deaths; few survivors convalescent for about six
months. |
1000 |
Vomiting and nausea in all personnel within 1 to 2 hours. Probably
no survivors from radiation sickness. |
5000 |
Incapacitation almost immediately (several hours). All personnel will
be fatalities within one week. |
Reference: 9, Table 3-36, p. 3-47; NASA-STD-3000 168
Figure 5.7.2.1.3.3.1-2 Relationship Between Mean Survival Time and Acute Radiation Dose for Man
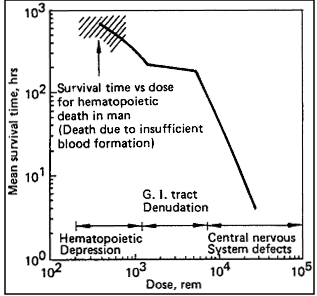
Note: This curve was extrapolated from animal studies and very few
human studies. This data holds only for acute total body radiation.
|
Reference: 9, Figure 3-37; NASA-STD-3000 169
5.7.2.1.3.3.2 Gastrointestinal or Precursor Effects
{A}
These symptoms include nausea, vomiting, and diarrhea. These may appear within an hour or two and subside within a day at any dose above about 50 - 100 rads.
After a short latent period, a feeling of fatigue is followed by depression and emotional disturbance accompanied by anorexia, nausea, retching, salivation, and vomiting. Intestinal cramps and diarrhea occur early at lethal doses. Symptoms reach a peak in about 4 to 6 hours and then improve rapidly. For 200 and 300 rads the peak may occur as quickly as two hours after exposure. The degree of upset and duration of recovery depend on the size and location of dose, on individual sensitivity and, most importantly, on the dose rate.
The time of onset of the precursor symptoms of nausea and vomiting, empirically derived, may be seen in
Figure 5.7.2.1.3.3.2-1. It is based on data from atom bomb casualties, nuclear accident victims, and the irradiation of cancer patients.
Figure 5.7.2.1.3.3.2-1 Anticipated Elapsed Time Between Irradiation and Onset of Severe Nausea and Vomiting in a Sample of 100 Persons Exposed to Lethal Level Radiation Doses
(cont)
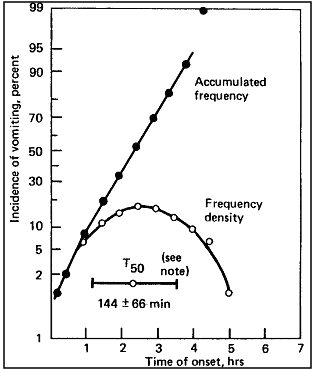
Note: T50 = Onset time for 50% of exposed population.
|
Reference: 9, Figure 3-41; NASA-STD-3000 179
The dose response may be probabilistically treated as a symptom dose affecting a specified fraction of an irradiated population, e.g., ED50 is the dose producing the symptom in 50% of an irradiated population.
Figure 5.7.2.1.3.3.2-2 gives the extrapolated ED10, ED50, and ED90 doses based on x-ray and gamma-ray experiments and should be considered conservatively, having higher ED values and a wider range of distribution than would be expected in a normal population.
Figure 5.7.2.1.3.3.2-2 Estimated High Intensity Radiation Dose Level Producing Early Prodromal Responses
| Clinical sign |
Absorbed dose for probability of response (rads) |
| 10 percent |
50 percent |
90 percent |
|
Anorexia
|
40
|
100
|
240
|
|
Nausea
|
50
|
170
|
320
|
|
Vomiting
|
60
|
215
|
380
|
|
Diarrhea
|
90
|
240
|
390
|
|
Note: Point of interest for dose estimate: a 26-cm diameter sphere in the
mid-epigastric region; Q assumed to be unity.
|
Reference: 9, Table 3-41; NASA-STD-3000 171
5.7.2.1.3.3.3 Hematological Effects
{A}
Acute hematopoietic (blood producing) symptoms, i.e. thrombocytopenia (lack of platelets), leukopenia, (lack of white blood cells), hemorrhage, and accompanying infection. These symptoms will appear within a few days to a
week and can reach a clinically aggravating level at doses of 50 - 150 rads or more to the marrow within several
weeks to a month.
Effects on the blood system due to radiation are largely dependent on damage to the marrow and lymphoid tissue. Damage to the cell inhibits normal division and reproduction of the elements, resulting in decreased blood counts.
Signs and symptoms then develop relating to the depletion of various elements of the blood. These symptoms include infections and fever relating to the depression of white blood cells and impairment of the immune system. Other symptoms include bleeding and anemia relating to platelet depression. These symptoms may lead to death if the bone marrow is incapable of responding in time by adequate cell regeneration.
The changes with time in most of the affected blood elements are fairly well correlated with the radiation dose to the bone marrow. Based on the dose relationship of these changes, the following four stages or prognosis may be made, corresponding to the four levels of radiation dose:
a. Almost certain survival - dose of less than 100 rads.
b. Probable survival - dose of 100 - 200 rads.
c. Possible survival - dose of 200 - 500 rads.
d. Improbable survival - dose greater than 500 rads.
Experimental evidence has shown the important role played by the three key
blood elements: lymphocytes, neutrophils, and platelets. The changes are
represented as percentages of normal counts. The dose levels producing a
specified blood element reduction are shown in Figure
5.7.2.1.3.3.3-1.
Figure 5.7.2.1.3.3.3-1 Estimated High Intensity Radiation Dose Levels to Produce Specified Percentage Reduction in Blood Elements *
Circulating element
|
Absorbed dose for reduction from normal (rads)**
|
|---|
|
10 percent
|
50 percent
|
75 percent
|
|
Platelets ***
|
50
|
120
|
250
|
|
Lymphocytes
|
60
|
150
|
300
|
|
Neutrophils
|
80
|
190
|
390
|
|
Notes:
* Symptoms appear within 1 to 10 days after bone marrow exposure.
** Point of interest for dose estimation average depth of 5 cm: Q assumed to be unity.
*** ~ 3, 25, and 30 days, respectively, for lymphocytes, neutrophils, and platelets.
|
Reference: 9, Table 3-44; NASA-STD-3000 172
5.7.2.1.3.3.4 Skin Tissue Effects
{A}
Widespread erythema (redness) and skin blistering are the primary effects of ionizing radiation on skin tissue. Under certain circumstances, such as EVA operations, high-intensity surface exposure with little deep tissue dosage may occur. Depending on the quality of the radiation, erythema will appear within a few hours to days following exposures of 400 to 800 rads. Due to the restrictions and abrasive contacts of the space suit, even a partial body moderate erythema could become extremely uncomfortable and somewhat incapacitating.
Figure 5.7.2.1.3.3.4-1 shows the air dose-response of the skin for these early symptoms following doses of x-rays. The skin reactions with adequate statistical data to make population dose response projections are erythema and moist desquamation. The statistical projections for these skin reactions are summarized in
Figure 5.7.2.1.3.3.4-2.
| Epilation - loss of hair |
Erythema (first degree burns) |
Moist desquamation and blistering (second degree burns) |
Ulceration (third degree burns) |
|---|
|
Rare at less than 200r
|
|
|
|
|
Partial epilation at 350-450r
|
Response is dependent on energy, dose rate, area exposed, and complexion of the individual. Full effect in 1 to 3
weeks after:
|
|
|
|
Complete epilation in 16-18 days at > 450 r
|
200 - 400 (<150 keV)500-600 r (200-400 keV)
|
|
|
|
Permanent epilation at > 700 r
|
800-1000 r (>400 keV)
|
|
|
|
Response in first hours at 1000 r
|
Effect in 1-2 weeks at > 1000 r
|
Rapidly progressive effect at > 2000 r
|
| Note:
* These statements are based on air doses. Dose estimates are at 0.1 mm depth where 1 r
~ 1 rad. |
Reference: 9, Table 3-41; NASA-STD-3000 173
Figure 5.7.2.1.3.3.4-2 Estimated Doses of High Intensity Radiation (Q = 1) at 0.1 mm Depth of Producing Erythema and Desquamation of the Skin
| Skin reaction |
Absorbed dose for probability of response (rads) |
| 10 percent |
50 percent |
90 percent |
| Erythema |
400 |
575 |
750 |
|
Desquamation
|
1,400
|
2,000
|
2,600
|
|
Note: An overall modifying factor (QE) weighted for LET should be applied to the dose values given here (Q+1 for LET 3.5
KeV/m, Q=3 for LET > 3.5 KeV/m). An area effectiveness factor of 1.25 is suggested to reduce the dose value given here when exposure involves skin areas up to or greater than 150 cm2
|
Reference: 9, Table 3-41; NASA-STD-3000 -174
5.7.2.1.3.3.5 Reproductive Cell Effects
{A}
The sterilizing effect of radiation on reproductive cells will not affect the success of a specific space mission, but may have a second- order, even first-order, psychological bearing on crew effectiveness during the whole program. Due to the high radiosensitivity of the sex cells lining the reproductive organs, the gonads are among the more sensitive organs of the human body.
Figure 5.7.2.1.3.3.5-1 shows the expected dose-response relationship for male sterility obtained from experience with electromagnetic radiation.
| Dose |
Response |
| 15 - 100 rad |
Progressive reduction in fertility with dose reduced sperm count (oligospermia)
and increased frequency of abnormal sperm. Above 100 rads, azoospermia is
usually evident at 10 weeks. |
| 200 - 300 rad |
Temporary, absolute sterility (azoospermia) for approximately 12 - 15
months after 10 weeks. |
| 400 - 600 rad |
Temporary sterility for 18-60 months. |
| > 600 rad |
Probably permanent sterility |
Reference: 9, table 3-52;NASA-STD-3000 175
5.7.2.1.3.3.6 Performance Degradation Effects
{A}
Degradation of general operational skills through direct and indirect physiological and neurological injury include lassitude and accompanied by nebulous symptoms of reduced performance capacity interfering with information processing, decision making, emotional stability, and motivation, often related to the prodromal symptoms described above. At higher doses, vascular shock, cerebral edema (swelling of the brain), and hypoxia (lack of oxygen) of the central nervous system, all contribute to the effects often referred to as the central nervous system syndrome.
Performance testing of monkeys before, during, and after irradiation to high dosages has shown a transient decline and subsequent recovery of one type of task and successful performance for other tasks. A slower reaction time was exhibited by animals given the highest exposures (greater than 750 rads).
5.7.2.1.3.4 Biological Effects of HZE Particles
{A}
High-energy HZE particles pose a special concern. First, when a single HZE particle slows down and stops in tissue, it forms a Micronesian in which many cells are destroyed in a diameter of 10 - 50 Angstroms. An outer sheath, extending out to 10 Angstroms, has injured or slightly irradiated cells. This Micronesian is a unique damage mechanism whose effect cannot be predicted based on the known effects of low- and high-LET radiation. Secondly, it is known that heavy ions are carcinogenic but their relative effectiveness is not well known. What is known is that the flux of HZE particles in space is low. There is still great uncertainty as to how large a risk these particles (and Fe56, in particular) pose to humans in space.
5.7.2.1.4 Ionizing Radiation Protection Design Considerations
{A}
Because crewmembers will encounter radiation in space from the sources listed in
Paragraph 5.7.2.1.1, a variety of strategies need to be considered for protecting them from the radiation hazards.
The first strategy is to set for each mission the applicable exposure limits based on the NASA radiation dose limits set in
Paragraph 5.7.2.2.1 and consistent with the mission objectives.
After this primary strategy, there are four main methodologies available: 1) bulk mass shielding, 2) active electromagnetic shielding, 3) chemical protectors, and 4) avoidance of high radiation fluxes by maneuvering of the spacecraft and careful scheduling of activities. Each of these methods is discussed below.
5.7.2.1.4.1 Mass Shielding
{A}
This is the main means of protecting crewmembers from space radiation. Space modules are constructed with an outer skin and associated structural members and sometimes an outer micrometeoroid/ space debris shield. In addition, the space module contains specialized equipment with considerable mass as well as having internal structural features (e.g., walls, cabinets). These internal features can provide some additional shielding, but in only some specific directions as these masses are not distributed uniformly and/or isotopically.
The primary structural material used on spacecraft is aluminum, which is an effective shielding material for all types of radiation. However, some materials shield certain types of radiation even better. For example, low atomic number materials (e.g., polyethylene) provide good protection from electrons; high atomic number materials (e.g., lead) provide good protection from bremsstrahlung radiation. Thus, use of specialized individual or composite materials may be considered for localized radiation shielding applications.
In addition to attenuating the primary incoming radiation, the shielding material can also produce secondary radiation due to its interaction with the incoming radiation. The production of bremsstrahlung by electrons penetrating a shield is a typical example. Incident protons present a more complex example, involving both secondary protons (from cascades of proton-shield nuclei interactions, and from evaporation off of recoiling nuclei) and secondary neutrons (evaporation off of recoiling shield nuclei). Even though the neutrons are less energetic than incident protons, neutron attenuation in the shield, which is governed by neutron interaction mechanisms, is weaker than proton attenuation. Furthermore, the quality factor Q for neutrons can be considerably higher than for protons (e.g., see
Figure 5.7.2.1.3.1-1). While secondary radiation needs to be accounted for, in most cases involving thin shields (gm/cm2), the primary radiation is the predominant contributor to the total dose rate.
5.7.2.1.4.2 Electromagnetic Shielding
{A}
Four different concepts for providing electromagnetic shielding to deflect the charged particles have been proposed. These include: 1) an electrostatic field, 2) a plasma shield, 3) a confined magnetic field, and 4) an unconfined magnetic field.
All of these concepts are deemed impractical. They have the distinct disadvantages of excessive weight and power penalties (some studies have given estimates on the order of 108 to 109 kg). Other disadvantages are 1) the extreme complexity of the design, manufacturing, installation, and maintenance; 2) they are not necessarily fail-safe; and 3) may have adverse biological effects of chronic exposure to the high field strengths. Moreover, these magnetic fields will lead to a trapped radiation belt around the space module.
5.7.2.1.4.3 Chemical Protectors
{A}
The use of chemicals with the ability to modify radiation response of mammalian cell systems should be considered. The most effective of these are the sulfhydryl compounds. The simplest of these is cysteine.
Sulfhydryl compounds are efficient protectors for low-LET radiation, however, they can have deleterious side effects and they have minimal effect on high-LET radiation. The mechanism by which sulfhydryl compounds are thought to function is that of scavenging free radicals in the body. Radiation interacts with biological cell systems by transferring energy to electrons, which eventually produce free radical molecules. The latter combine with oxygen in the cells to form highly reactive products that eventually break chemical bonds. The sulfhydryl compounds block the process by reacting with the free radicals in competition with oxygen.
Animals injected with cysteamine before being irradiated with x-rays have shown a dose reduction factor of 1.8. However, the sulfhydryl compounds as well as newer compounds developed at Walter Reed Hospital have been of limited usefulness for protecting humans despite continuing research being carried out in the United States and the Soviet Union.
5.7.2.1.4.4 Avoidance of High Radiation Fluxes
{A}
The intensity of space radiation varies widely with respect to time and location. Thus, crewmembers can be protected from some types of radiation by adjusting orbits and by carefully scheduling activities.
For low Earth orbits, the higher the altitude, the higher the fluxes of the trapped belt radiation, as can be seen in
Figure 5.7.2.1.3.3-1. As seen in this figure, the increase of radiation flux is strongly dependent on altitude, so orbit adjustments must depend on knowing in which direction it is advantageous to move to decrease the radiation exposure.
Time scheduling could involve such factors as trapped belt and galactic cosmic radiation variations. A simple example of judicious scheduling in low inclination, low Earth orbits is to not schedule EVA activities for those few orbits per day (e.g., 5 to 6 out of 15 to 16 orbits) which will pass directly through the South Atlantic Anomaly. This is clearly shown in
Figure 5.7.2.1.2.1-2, which presents the variation in absorbed dose per orbit over a five-day period, and depicts the daily 12 to 15-hour duration over which no dose is acquired since those orbits avoid the SAA.
5.7.2.1.4.5 Radiation Fields in Polar and Geosynchronous Orbit
{A}
Geosynchronous (GEO) and polar (PEO) Earth orbits are accessible to both solar and galactic cosmic rays, so other considerations are required to avoid and/or design for the high radiation fields these missions encounter. The major radiation threat is from solar cosmic rays (SCR, essentially all protons) emitted during solar particle events (SPEs). Since SPEs occur randomly, usually during the middle five years of an 11-year solar cycle (see
Paragraph 5.7.2.1.2.3), the major reliance has to be on radiation monitoring to provide advance warning to the crew, and a storm shelter of adequate shielding thickness to protect the crew during the duration (up to 1-2 days) of the event. GEO orbits are totally accessible to SCRs because the shielding effect of the Earth's magnetic field is fully dissipated out to such orbits (altitude of approximately 36,000 km [19,000 nm]). For polar missions, geomagnetic shielding is in effect for a portion of the orbit but absent for the remainder, the proportions depending on how the geomagnetic cutoff affects the specific altitude and inclination of the orbit.
Galactic cosmic rays (GCR, with HZEs comprising several percent) are also accessible to PEO and GEO missions for the same reason as with
SCRs, i.e., the absence of geomagnetic shielding. The GCR flux is much lower than the intense SCR bursts but is approximately constant over time (aside from variations with solar cycle). The magnitude of the GCR flux is known as a function of altitude and inclination (see
Figure 5.7.2.1.2.2-3) so its effect on a particular mission can be predicted and designed for. The major uncertainty appears to be in the unique biological effects of HZE particles (see
Paragraph 5.7.2.1.3.4) and what special design measures should be incorporated to protect against them.
PEO and GEO missions will also encounter trapped belt radiation. GEO orbits will involve only the energetic electrons of the outer belt and the bremsstrahlung they produce in shielding materials. For polar missions, depending on the altitude and inclination of the orbit, SAA protons and electrons of the inner belt will both contribute.
{A}
Because the various types of ionizing radiation have different biological effects and because radiation exposure rates will vary with location in the space module, a variety of radiation dosimetry systems will be required. Portable multisensor area monitors should be used to detect all of the expected types of radiation and to measure and record the radiation levels at various locations within the manned areas of the space module. Personnel monitoring dosimeters should be used to measure and record the radiation exposures of individual crewmembers. Other locations, such as where biological test subjects are maintained and where radioactive tracers are kept, should be monitored by the combined use of area monitors, personnel dosimeters, and other special equipment.
5.7.2.1.5 Low Earth Orbit Environment
{A}
Current missions are restricted to Low Earth Orbit (LEO). Figure 5.7.2.1.5-1 shows data taken during the high inclination STS-28 flight and illustrates the contributions of the three natural sources of radiation for a particular mission. The GCR component varies cyclically with ground track. Maximums in GCR dose rates occur at the extreme northern or southern portion of the orbital track. Minimums correspond to transits of the geomagnetic equator, where the space module experiences the maximum geomagnetic protection from GCR. At periodic intervals large spikes in the exposure rates are encountered which correspond to passages through the SA. The largest spikes are passages through the regions of peak SAA intensity; smaller peaks represent passage through the fringes of the SA. A unique feature of this data is the effects of a solar particle event (SPE) measured in LEO. Peaks in the dose rate attributed to the SPE occur at the extreme northern or southern portions of the orbital track. Whereas the GCR and SAA components shown in the Figure are typical for high inclination flights at relatively low altitude, the effects of SPEs on dose rates will depend upon a variety of parameters. Actual environmental conditions will depend upon orbital inclination, altitude, solar cycle and geomagnetic conditions.
Figure 5.7.2.1.5-1 Measured Dose Rate vs. Time for A High Inclination Shuttle Flight (STS-28) During A Solar Particle Event
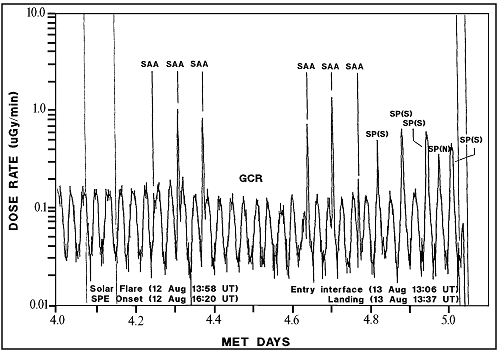
|
| COMPONENT |
MISSION
DOSE CONTRIBUTIONS (µGy) |
| GCR: Galactic Cosmic Radiation |
515 |
| SAA: South Atlantic Anomaly |
95 |
| SP(S): Solar Protons, Southern Latitude |
16 |
| SP(N): Solar Protons, Northern Latitude |
Reference: 414; NASA-STD-3000 515
5.7.2.2 Ionizing Radiation Design Requirements
{A}
5.7.2.2.1 Ionizing Radiation Exposure Limits
{A}
Astronauts have been classified as radiation workers and therefore a program must exist to protect them from excessive radiation exposure. The Presidential Executive Order 12196 requires all federal agencies, including NASA, comply with Occupational Safety and Health Administration regulations related to ionizing radiation exposure. While NASA is required to follow OSHA regulations, no OSHA standards exist for spaceflight. Terrestrial radiation exposure guidelines provided in the Code of Federal Regulations (29 CFR 1910.96) are too restrictive for space activities and therefore have been judged to be inappropriate. NASA can establish supplementary standards for appropriate control of radiation for astronauts in accordance with 29 CFR 1960.18.
The following NASA requirements serve as a basis for the implementation of the supplementary standard: (1) that its use applies to a limited population, (2) maintenance of detailed flight crew exposure records, (3) preflight hazard assessment/appraisal, (4) planned exposures be kept As Low As Reasonably Achievable (ALARA), (5) maintenance of operational procedures and flight rules to minimize the chance of excessive exposure and (6) man-made onboard radiation exposure complies with 29 CFR 1910.96 except where the NASA mission objectives cannot be accomplished otherwise.
NASA has adopted the recommendations that the National Council on Radiation Protection and Measurements (NCRP) presented in its Report 98, Guidance on Radiation Received in Space Activities (July, 1989) as the basis for the supplementary standard for spaceflight crew radiation exposures. The maximum exposure limits are presented in
Figure 5.7.2.2.1-1. Whereas monthly and annual limits primarily exist to prevent the short term physiological effects of exposure, career limits exist to contain radiation risk within a 3% increased lifetime cancer mortality. The recommendations of the NCRP apply to activities in low Earth orbit, such as Space Station. For comparison, astronaut exposure limits are greater than those of terrestrial radiation workers, which are set to not exceed 5 rem per year.
Figure 5.7.2.2.1-1 Ionizing
Radiation Exposure Limits for Spaceflight
Ionizing Radiation Exposure Limitsa
Exposure
interval |
Dept
(5 cm) |
Eye
(0.3 cm) |
Skin
(0.01 cm) |
|---|
|
30 days
|
25 REMb
|
100 REM
|
150 REM
|
| Annual |
50 REM |
200 |
300 |
| Career |
100 to 400c |
400 |
600 |
Career Exposure by Age and Sex
| Sex |
Age |
|
25
|
35
|
45
|
55
|
|
Male
|
150 REM
|
250 REM
|
325 REM
|
400 REM
|
| Female |
100 |
175 |
250 |
300 |
FOOTNOTES:
a. These space flight crew ionizing radiation dose-equivalent limits, recommended to NASA by the National Council on Radiation Protection and Measurement, (Guidance on Radiation Received in Space Activities-NCRP Report No. 98, July 31, 1989) have been legally adopted as the Agency's supplementary standard in accordance with 29 CFR 1960.18.
b. This table is expressed in conventional units due to common usage by the discipline. The SI unit is Sievert (Sv), which is equivalent to 100 rem.
c. The career depth dose-equivalent limit as based upon a maximum 3 percent
lifetime excess risk of cancer mortality. The total dose-equivalent yielding
this risk depends on sex and age at start of exposure. The career dose-equivalent
limit is approximately equal to:
200 + 7.5 (age - 30) rem for males
up to 400 rem maximum
200 + 7.5 (age - 38) rem for females
up to 400 rem maximum
Reference: 206 Table 7-3; NASA-STD-3000 - 416
5.7.2.2.2 Ionizing Radiation Protection Design Requirements
{A}
The following strategies shall be used to implement radiation protection features for crewmembers:
a. Radiation Protection - The design of habitable space vehicles shall include the necessary radiation protection features (shielding, radiation monitoring and dosimetry, etc.) for all expected missions to ensure that the crew dose rates are kept as low as reasonable achievable (ALARA levels) and that the maximum allowable dose limits are not exceeded.
b. Use of Onboard Mass - The design and layout of the space modules shall make optimal use of onboard mass as radiation shielding.
c. Radiation Contingency Plans - The habitable space module radiation environment enhancements (external/internal) will be confirmed and monitored by the space modules onboard radiation instrumentation. Flight Rules for enhanced radiation conditions, including adherence to crew radiation exposure limits, will be implemented to accomplish a timely and orderly hazard assessment and to determine the necessary actions(s) required to minimize exposure. Flight Rules action requirements, which range from no action to crew de-orbit ASAP are dependent on the exposure magnitude and rate, and projected end-of-mission enhancement accumulation.
d. Mission Radiation Control Program - A mission radiation control program shall be instituted to establish procedures and responsibilities consistent with the expected mission environment and duration of orbital stay in order to keep radiation exposures to crew at ALARA levels and within the established radiation exposure limits.
e. Onboard Radioactivity - The use of radioactive isotopes and radiation producing equipment onboard the habitable space modules will require adherence to standard ground-based radiation safety practices, including consideration of microgravity effects on those practices (cases review for exceptions determined by NASA objectives /policy).
f. Cumulative Crewmember Radiation Dose - The radiation dose equivalent accumulated by each space module crewmember shall be monitored throughout the active career of all crewmembers. Thus, career, as well as mission dose equivalent levels shall be kept ALARA, thereby ensuring that the maximum career dose equivalent
limit shall not be exceeded.
5.7.2.2.3 Ionizing Radiation Monitoring and Dosimetry Design Requirements
{A}
The following design requirements shall be observed to limit the radiation dose that the crewmembers could acquire during a given mission on the space module.
a. Radiation Monitoring - The accumulated radiation dose within the occupied areas of the space modules shall be monitored and recorded for all mission. Radiation dose rates within the spacecraft shall also be monitored and recorded.
b. Crewmember Radiation Dose Monitoring - For each crewmember the radiation dose shall be measured, recorded, the effective dose equivalent calculated and stored as part of the crew's radiation exposure history.
c. Charged Particle Monitoring - Proton and other particle fluxes and their energy spectrum within the space module shall be monitored and recorded. Particle radiation characteristics such as particle direction and secondary particle flux, (i.e., neutrons) shall be monitored.
d. Location of Radiation Detectors - The location and characteristics of the onboard radiation detectors shall be consistent with the expected radiation environment.
e. Radiation Dose Management System - A radiation dose management system shall be provided for keeping track of crew cumulative radiation exposure records, scheduling and assigning crew activities and alerting personnel that are approaching their radiation dose limits.
f. Radiation Event Warning - A radiation detection system shall be provided which continuously monitors the interior radiation levels, records the accumulated dose, and can be read out on command from Mission Control and provides clear notification of radiation conditions within the space module.
5.7.2.2.4 Ionizing Radiation Personnel Protection Design Requirements
{A}
The following personnel protective equipment shall be provided, or be available, to assist and protect crewmembers during their mission:
a. EVA Radiation Protection - EVA shall not be scheduled during orbits passing through the South Atlantic Anomaly unless space suits and helmets incorporate radiation shielding.
b. Protective IVA Garments - Personal shielding devices, which are to be worn if and when the crew encounters high radiation conditions, are being considered for each crewmember.
c. Radioactive Contamination Control - Protective garments, equipment and procedures shall be established for dealing with possible radioactive contamination associated with any of the manmade radiation sources onboard.
5.7.3 Non-Ionizing Radiation
{A}
5.7.3.1 Non-Ionizing Radiation Design Considerations
{A}
5.7.3.1.1 Types of Non-Ionizing Radiation
{A}
Non-Ionizing Radiation (NIR) consists of the broad band of electromagnetic radiation having frequencies less than approximately 3E X 1015 Hz, i.e., from about 3 to 3 X 10E15 Hz, or, expressed differently, having wave lengths in the range 10 E8 to 10 E7m (see
Figure 5.7.3.1.1-1). In actuality, the dividing line between ionizing and non-ionizing radiation has been somewhat arbitrary, but the current definition sets electromagnetic radiation with energy of 12 ev (frequency of about 3E15 Hz) as the upper limit of non- ionizing radiation. (As seen in
Figure 5.7.3.1.1-1, this means that the far end of the ultraviolet spectrum is to be classified as ionizinbg.)
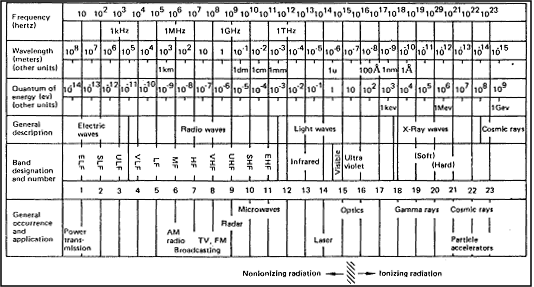
Reference: 297; NASA-STD-3000 114
While the precise identification of the transition point from non-ionizing to ionizing radiation is not crucial, it is clear that the main biological effect of non-ionizing radiation is the production of heat within tissue. However, for ultraviolet radiation (in addition to thermal reactions) other biological effects can occur as a result of chemical changes and electronic excitations, inducing effects such as skin erythema, eye inflammation (photokeratoconjunctivitis), and skin cancer. Similarly, visible radiation can also produce nonthermal transient effects to the eye (iritis, eye fatigue, etc.).
For purposes of health protection, electromagnetic NIR can be divided into a number of wavelength or frequency ranges:
a. Optical radiation, encompassing radiation with wavelengths over the range of
10-7 to 10E-3 m. Optical radiation is further divided into three parts:
1. Ultraviolet radiation (UV), with wavelengths between 4 × 10E-7 to 10E-7 m (100 - 400 nm).
2. Visible radiation, with wavelengths between 4 × 10 E-7 to 7.6 × 10 E-7 m (400 - 760 nm).
3. Infrared radiation (IR), with wavelengths between 7.6 × 10 E-7 to 1 × 10 E-3 m (760 nm - 1 mm).c. Galactic Cosmic Radiation - Similar to the Radio frequency radiation (RF), including microwaves (MW), having frequencies in the range of 300 to 3E11 Hz (300 Hz - 300 GHz) corresponding to wavelengths in the range of 1E3 km to 1 mm.
c. Extremely Low Frequency (ELF) fields with frequencies less than 300 Hz, in practice mainly power frequencies of 50 to 60 Hz.
This is not the only breakdown available and, in practice, various other classifications are used according to particular needs. In addition, NIR also includes pressure waves such as ultrasound and infrasound, which are on either side of the audible frequency range (20 Hz to 20 kHz), and electrostatic and magnetostatic fields.
The field of non-ionizing radiation has been marked by the use of different terminologies and protection concepts that vary significantly between the different types of radiation and their applications. The development of regulations and standards for NIR has been hampered by the lack of uniformity in terminology, quantities, units, etc. However, in terms of applicability to space modules, some parts of the NIR spectrum will pose particular problems requiring design considerations while other parts of the spectrum will not.
5.7.3.1.2 Sources of Non-Ionizing Radiation
{A}
Humans in space modules will be subject to non-ionizing radiation emitted from two different kinds of sources, those occurring naturally in space and those emanating from man- made equipment onboard the space module. The naturally occurring space radiation is comprised of electromagnetic radiation as well as charged particles. The electromagnetic component of space radiation may be categorized into four main sources:
a. Continuous Solar Emissions - The Sun emits a very broad spectrum of electromagnetic radiation. Of particular interest is the optical radiation band, which approximately resembles a blackbody spectrum based on a temperature of 5900 K (see
Figure 5.7.3.1.2-1). This spectrum is peaked in the visible region (approximately 550 nm) and rapidly increases in intensity from the far UV (approximately 100 nm) to the visible (approximately 400 nm). The unique aspect of the UV environment in space compared to that on the Earth's surface is the lack of shielding against the solar irradiation provided by the Earth's ozone layer in the atmosphere.
Electromagnetic radiation in the radio frequency range is also emitted but is of low intensity. Radioflux is typically measured and recorded on Earth at 2800 MHz.
b. Solar Flare Events - Electromagnetic radiation over the optical and radio frequency wavelengths is emitted by the Sun during solar flares for short periods of time.
This electromagnetic radiation may even be emitted by small flares that do not produce solar cosmic rays (see
Paragraph 5.7.2.1.2). The different radio frequency waves are generated at different altitudes in the solar atmosphere (e.g., microwave bursts are produced in the lower part of the corona). These radio frequency bursts are still not a problem in terms of direct biological effects on the crew. (Flux units are 10 E-22 W/m2 Hz, and a peak may produce up to 10 E5 flux units [10 E-9 W/m2] but may affect them indirectly by interfering with onboard electrical equipment communications, instrumentation, etc). For optical radiation, the increased intensity in the visible and UV range would be dealt with as an upper bound to the radiation from the continuous solar emissions.
c Case of solar emissions, non-ionizing electromagnetic radiation produced by astronomical sources outside the solar system reach the Earth but are of such low intensity that they do not pose a problem in terms of their biological effects.
Figure 5.7.3.1.2-1 Spectral Distribution Curves related to Solar Optical radiation: Shaded Areas Indicate Absorption at Sea Level Due to the Atmospheric Constituents Shown
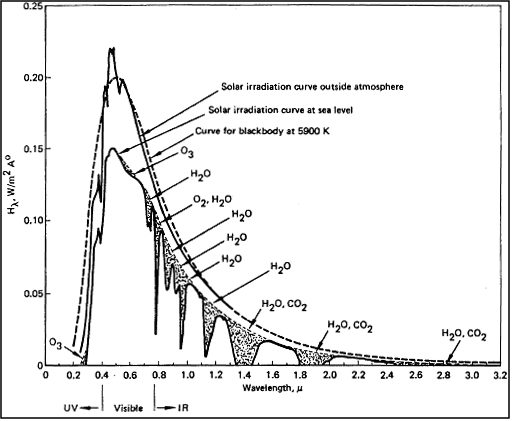
Reference: 289, Figure 37; NASA-STD-3000 115
d. Sources of Magnetic Fields - The magnetic fields associated with various objects within the solar system vary over many orders of magnitude. At the center of sunspots, magnetic fields a thousand times that of Earth are to be found, although the magnetic field on the undisturbed surface of the Sun is 1% of that. The moon, stars, and Venus have magnetic fields between 1% and 10% of that of Earth, whereas Jupiter's magnetic field is 1000 times that of Earth.
e. Onboard Radiation Sources - Equipment-generated sources of non-ionizing radiation exist onboard the spacecraft in various forms and fall into the following general types.
1. Communication equipment (radar, radio, and microwave transmitters, receivers, antennas, and related equipment).
2. Lasers.
3. Lamps (UV, visible and IR).
4. Electronic equipment.
5. Welding equipment (when in use).
6. Electric power, power-conditioning and distribution equipment.
7. Miscellaneous.
5.7.3.1.3 Human Responses to Non-Ionizing Radiation
{A}
As indicated in Paragraph 5.7.3.1.1, for each main type of non-ionizing radiation, protection concepts have varied significantly. Thus, the human responses will be dealt with separately, first for radio frequency radiation and then for optical radiation.
a. Radio frequency Radiation - A large body of literature has been developed indicating the adverse biological effects of radio frequency electromagnetic radiation on both humans and animals. A typical tabulation of some of these effects is shown in
Figure 5.7.3.1.3-1.
Figure 5.7.3.1.3-1 Some Biological Responses to Radio Frequency Radiation
Response
|
Human response and description
|
|---|
|
Perception of heat
|
13 to 59 mW/cm2 for 4 sec at 3000 and 10,000 MHz
(observations in humans).
|
|
Pain threshold
|
1800 mW/cm2 for 60 sec at 3000 MHz (observations in humans).
|
|
Cataracts
|
Lens clouding when temperature of lens increases by 4°K (4°C). Accumulation of subclinical damage at low power densities for short durations may yield cataracts. Evidence still equivocal.
|
| Reproductive detriment |
|
Testes
|
Intrascrotal temperatures rise of > 1°K (> 1°C) by rf radiation or any other means reduces viable sperm count; this effect is usually reversible. Exposure to 2880 MHz at 5mW/cm2 for an indefinite period is the "threshold" for evidence of testicular damage in the most sensitive dog out of 35 dogs tested. Exposure to 3000 MHz at 8m/cm2 did not effect mating of mice or rats.
|
|
Ovaries
|
No evidence that exposure to 10mW/cm2 or even somewhat greater interfere with reproduction in female mice.
|
|
Visceral effects
|
|
Gastric ulcers
|
> 100 mW/cm2 for >= 10 min.
|
|
Delay of gastric secretion and emptying
|
0.05 to 1 mW/cm2 for 30 min. Reversible.
|
|
Hematopoietic effects - Leukocytosis, lymphocytopenia, eosinopenia, red blood cell lifespan alteration,
impaired bone marrow function, hemoglobin decreases, platelet decrease, reticulocytosis, etc.
|
Generally, long exposure to > 10 mW/cm2 are required to yield an effect. Effects are generally reversible.
|
| Cardiovascular effects - Blood flow changes,
blood pressure decrease, heart rate increases, etc. |
Effects generally attributable to peripheral vasodilation and hemodilution in response to heat stress.
|
| Central nervous system - Agitation, drowsiness,
muscular weakness, electroencephalogram changes, avoidance behavior, altered conditioned response, decreased endurance, headache, etc.
|
Large number of studies; some with occupationally exposed humans; some conflicting results.
Eastern Europeans claim effects < 10 mW/cm2; investigators in Western countries have not
always observed these effects even at higher exposure levels. This is the area of greatest controversy.
|
Reference: 289, Table 44; NASA-STD-3000
116
For human exposure to electromagnetic energy at radio frequencies from 300 kHz to 100 GHz, two standards groups have recently reviewed the literature on the biological effects of electromagnetic radiation and issued RF exposure limits.
The American National Standards Institute (ANSI) screened only those reports that produced positive findings, were reproducible, and supplied adequate dosimetric information. Behavior in experimental animals was found to be the most sensitive indicator of an adverse health effect (e.g., convulsions, work stoppage, etc.). Based on the review, ANSI concluded that acute (less than 1 hour) exposure to electromagnetic radiation deposited in the whole body at an average specific absorption rate (SAR) of less than 4 W/kg (0.1 BTU/lb-min) does not produce an adverse health effect in animals. However, because prolonged exposure (days and
weeks) may cause damage, a safety factor of 10 was introduced reducing the permissible SAR to 0.4 W/kg (0.01 BTU/lb-min). Based on SAR, ANSI developed radio frequency protection guides (RFPG) in terms of mean squared electric (E2) and magnetic (H2) field strengths and the equivalent plane wave power densities which should not be exceeded. The American Conference of Governmental Industrial Hygienists ACGIH) has adopted the ANSI limits as their threshold limit values (TLVs).
The International Non-Ionizing Radiation Committee (INIRC) of the International Radiation Protection Association (IRPA) reviewed the body of information on the biological effects of electromagnetic radiation more recently than ANSI. They used the same basic limit of the SAR, 0.4 W/kg (0.01 BTU/lb-min) for frequencies of 10 MHz and greater to obtain derived limits. Their derived occupational exposure limits were based on an SAR of 0.4 W/kg (0.01 BTU/lb-min) averaged over the whole body for six minutes or an SAR of 4 W/kg (0.1 BTU/lb-min) averaged over 1 gm (.04 oz) of tissue for six minutes.
A limited and generalized tabulation of the effects of RF radiation on humans is presented in
Figure 5.7.3.1.3-2, which is based on the IRPA guidelines.
Figure 5.7.3.1.3-2 Absorption Characteristics of Radio Frequency Radiation in the Human Body
| RF frequency |
Human effect |
|---|
|
< 30 MHz
|
Subresonance range, Surface absorption dominates for the trunk, but not for the neck and legs, and the energy absorption decreases rapidly with frequency.
|
|
30 MHz-400 MHz
|
Resonance range for the whole body (up to 300 MHz) and, when considering resonances in the head, up to 400 MHz. High absorption cross sections are possible due to the resonance.
|
|
400 MHz-3000 MHz
|
"Hot spot" frequency range over which significantly localized energy absorption can be expected at incident power densities of about 100 W/m2(10mW/cm2). The size of the hot spots range from several centimeters at 915 MHz to 1-2 centimeters at 3000 MHz. Hot spots are caused by resonances at the lower frequencies and by quasioptical focusing of the incident fields at the higher frequencies. For the human head the hot spot range extends from 300-2000 MHz.
|
|
> 3000 MHz
|
Surface absorption range
|
Reference: 302, Appendix 1; NASA-STD-3000 117
b. Optical Radiation (Lasers) - The biological effects induced by optical radiation are essentially the same for coherent sources (lasers) and incoherent sources for any given wavelength, exposure area, and duration. However, there is a necessity to treat lasers as a special case because very few conventional optical sources can approach the radiant intensities and irradiances achieved by lasers. Furthermore, because much of the early data on biological effects were developed using conventional optical sources, with emission of radiation over a broad band of wavelengths, these data are not directly applicable to the highly monochromatic emissions of lasers. The degree of uncertainty in relating biological thresholds derived from broadband and monochromatic sources has frequently led to the use of safety factors in the exposure limits (EL) for lasers, particularly in the case of UV lasers.
The eye and skin are critical organs for laser radiation exposure. The type of effect, injury thresholds, and damage mechanisms vary significantly with wavelength. In addition, the consequences of overexposure of the eye are generally more serious than that of the skin. Consequently, safety standards have emphasized protection of the eye. The main adverse human responses are Erythema (skin reddening), Photokeratitis (inflammation of the cornea), conjunctivitis, and retinal damage (see
Figure 5.7.3.1.3-3).
(Refer to Reference 303 for detailed discussions of the specific biological damage mechanisms due to laser exposure.)
Exposure limits have been set by various standards organizations for the control of coherent optical radiation from lasers. Although these ELs have been developed for terrestrial applications, limits very similar to these would be expected to be set for the protection of astronauts in space.
The ELs for lasers are more complex than those for incoherent optical radiation because a number of different parameters have to be specified.
(A summary of these ELs is given in Paragraph 5.7.3.2.1. For additional details, References
303 or 305 should be consulted.)
Regarding laser safety for the eye, it is important to distinguish between a point source and an extended source. Although exact geometrical definitions are not possible, ELs for extended sources apply to sources that subtend a visual angle greater than a limiting angle termed alpha minimum. Alpha minimum is the minimum viewing angle measured at the eye that is subtended by an extended source and is defined in terms of the range (laser to target), laser beam diameter at range, and the viewing angle (between range and viewing range (eye to target). Values of alpha minimum vary with exposure duration and wavelength and are given (in milliradians) for two spectral bands in
Figure 5.7.3.2.1-3. The ELs for extended sources are given in units of radiance (W/m2sr) and integrated radiance (J/m2sr). For point sources the units are different, namely irradiance (W/m2) and radiant exposure (J/m2).
c. Optical Radiation - Incoherent Ultraviolet
Light - Life has evolved under the daily exposure to solar radiation. Although
UVR is only about 5% of the sunlight that reaches the Earth's surface, it has
sufficient energy to initiate biological effects that may be injurious. The
critical organs for UVR exposure are the eye and skin because they may be readily
exposed. The main adverse human responses are erythema, skin cancer, photokeratoconjunctivitis,
cataracts, and retinal damage.
Figure 5.7.3.1.3-3 Impact of
Optical Radiation on the Eye
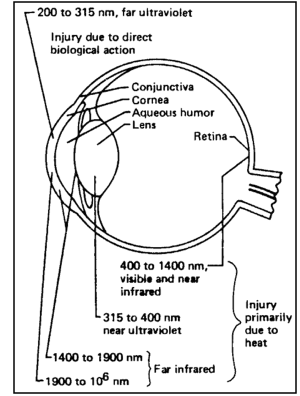
Reference: 4, Figure 6.8-1; NASA-STD-3000 118
(Refer to Reference 304 for detailed discussion of the biological damage mechanisms from UV light.)
Exposure limits have been established by various standards organizations for the control of ultraviolet radiation from all incoherent sources: solar radiation (the main one in spacecraft), fluorescent lamps, welding and other arcs, gas discharges, etc. The most restrictive limits are for exposure to radiation having wavelengths less than 315 nm. Although these ELs have been developed for terrestrial applications, limits very similar to those would be expected to be set for the protection of astronauts in space.
To determine the effective irradiance of a broadband source weighted against the peak spectral effectiveness curve (at 270 nm), the following weighting formula should be used: where:
Eeff = effective irradiance in W/m2 (J/s/m2) normalized to a monochromatic source at 270 nm
E = spectral irradiance from measurements in W/nm/m2
S = relative spectral effectiveness (unitless)
= band width in manometers of the calculation or measurement intervals.
Permissible exposure time in seconds for exposure to actinic UVR incident upon the unprotected skin or eye may be computed by dividing 30 J/m2 by the value of Eeff in W/m2. The maximal exposure duration may also be determined using
Figure 5.7.3.2.1-9, which provides representative exposure durations corresponding to effective irradiances in W/m2 or W/cm2.
d. Optical Radiation - Infrared - Most biological tissue is considered opaque to the longer wavelength IR radiation (wavelength greater than 1500 nm) because of the essentially complete absorption of the radiation by the water within the tissue. The primary biological response to this longer wavelength IR is, therefore, thermal. Short wavelength IR, with wavelengths between 760-1500 nm, can produce adverse biological effects such as acute erythema, increased vasodilatation of the capillaries and increased pigmentation that can be permanent. The interior parts of the eye (iris, lens and retina) will also be affected by this shorter wavelength IR, whereas the longer wavelength IR will have a thermal effect on the corne. The close association between sensation of pain and the absorption of IR radiation usually precludes severe acute effects other than those discussed here.
5.7.3.1.4 Non-Ionizing Radiation Protection Design Considerations
{A}
The following design considerations should be accounted for in order to protect crewmembers against non-ionizing radiation.
a. Radio frequency Radiation Source Identification - All the radio frequency systems (radar, microwave, radio, etc.) onboard the spacecraft should be identified, described, and classified. This should include all equipment used to transmit and receive signals to and from the spacecraft as well as internal radio frequency, and electrostatic and magnetostatic sources.
b. Electromagnetic Leakage - For each of the RF, electrostatic and magnetostatic sources, the electromagnetic leakage level (field strength, power density) at the exterior of the source should be measured to ensure that it is well within the exposure limit.
c. Optical Radiation Source Identification - All the optical radiation sources (lasers, UV, visible, and IR lamps, welding equipment, etc.) onboard the space module should be identified, described, and classified.
d. Electromagnetic Hazards Analysis - For all of the RF and optical radiation sources identified, a systematic failure modes and effects analysis (FMEA) may be performed to ensure that all resulting hazards can be safely handled by the crew.
e. Window Locations - In the design and location of spacecraft windows (see
Paragraph 11.11, Windows) consideration should be given to the protection of crewmembers against both direct and reflected (off large solid angle surfaces with high reflectivity in the UV range) UV radiation.
f. RF Aperture Locations - In the design and location of electromagnetic apertures throughout the spacecraft, consideration should be given to the protection of the crew against both direct, reflected, and scattered electromagnetic radiation.
g. Use of Lasers - In using lasers, the most effective means of hazard control is total enclosure of the laser and all beam paths. For conditions where such total containment is not possible, one or more of the following measures should be used: partial beam enclosure, laser eye protectors, administrative controls, and restricted access to beam paths.
5.7.3.2 Non-Ionizing Radiation Design Requirements
{A}
5.7.3.2.1 Non-Ionizing Radiation Exposure Limits
{A}
The following non-ionizing radiation exposure limits shall apply:
a. Radio frequency Electromagnetic Fields Exposure Limits - The American National Standards Institute (ANSI) Radio Frequency Protection Guides (RFPG) for occupational exposure are shown in
Figure 5.7.3.2.1-1 and illustrated in Figure
5.7.3.2.1-2.
b. Optical Laser Radiation Exposure Limits - The following laser exposure limits [contained in both the ANSI and American Conference of Governmental Industrial hygienists (ACGIH) standards] apply to continuous lasers [for repetitively pulsed lasers, the additional stipulations given the ANSI and ACGIH standards shall apply (Z136.1-1986, ANSI Standard for the Safe Use of Lasers, May 23, 1986; and ACGIH Threshold Limit Values and Biological Exposure Indices for 1987-1988; respectively.)].
1. Determination of Point Source or "Extended Source" Laser Exposure Criteria Applicability - Exposure limits for Extended Sources shall apply to sources that subtend a visual angle measured at the eye greater than the alpha-minimums given in
Figure 5.7.3.2.1-3. Point Source exposure limits shall apply to sources with alpha-minimums less than those shown.
2. Point Source Laser Eye Exposure Limits - The eye exposure limits given in
Figure 5.7.3.2.1-4 shall apply to all point source lasers.
3. Extended Source Laser Eye Exposure Limits - The eye exposure limits given in
Figure 5.7.3.2.1-5 apply to all extended source lasers.
4. Extended Source Laser Skin Exposure Limits - The skin exposure limits shown in
Figure 5.7.3.2.1-6 shall apply to all extended source lasers.
5. Exposure Limits for Commonly Available Types of Lasers - The eye and skin laser exposure limits for specific types of lasers shown in
Figure 5.7.3.2.1-7 shall apply (these limits are derived from the limits given in the above figures).
c. Incoherent Ultraviolet Optical Radiation Exposure Limits
1. Determination of Combined Continuous and Pulsed UV Exposure Average - The irradiance from continuous exposure and radiant exposure for time-limited or pulsed exposures to the eye or skin shall be averaged over the area of a circular measurement aperture of less than 1 mm (0.03937 in.) diameter.
2. UV-A Spectrum (315-400 nm) Radiation Exposure Limits - The total irradiance incident upon unprotected skin shall be less than 10 W/m2 (0.053 BTU/ft2-min.) For periods of exposure longer than 1000 seconds. For exposure times less than 1000 seconds, radiant exposure shall be less than 1 J/cm2 (0.006 BTU/in2).
3. Actinic UV Spectrum (180-315 nm) Radiation Exposure Limits - (The following UV exposure limits are contained in both ACGIH and IRPA standards). The limits for radiant exposure incident upon the unprotected skin or eye within the 8-hour period are given in
Figure 5.7.3.2.1-8.
The maximum exposure durations to broadband actinic UV sources are given in Figure 5.7.3.2.1-9 (see
Paragraph 5.7.3.1.3.c for the formula to be used to derive the effective irradiance).
4. Broad-Band Optical Sources - The spectral weighting functions listed in Figure 5.7.3.2.1-10 shall apply in determining broad-band optical exposure limits. (See ACGIH for formulae needed to calculate exposure times).
Figure 5.7.3.2.1-1 Occupational
Exposure Limits for Radio Frequency Electromagnetic Fields *
1
Frequency Range (MHz) |
2
Electric field Strength (E) (V/m) |
3
Magnetic Field Strength (H)(A/m) |
4
Power Density (S)E - Field, H - Field (mW/cm2) |
5
Averaging Time
½E½ 2, S or , S or ½H½2
(minutes) |
0.003 - 01 |
614 |
163 |
(100,1 000 000) +
|
6 |
6 |
0.1 - 1.34 |
614 |
16.3/ƒ |
(100,10 000/ƒ2) +
|
6 |
6 |
1.34 - 3.0 |
823.8/ƒ |
16.3/ƒ |
(180/ƒ2, 10 000/ƒ2) +
|
ƒ2/0.3 |
6 |
3.0 - 30 |
823.8/ƒ |
16.3/ƒ |
(180/ƒ2, 10 000/ƒ2) +
|
30 |
6 |
30 -100 |
27.5 |
158.3/ƒ1.668
|
(0.2, 940 000/ƒ3.336) +
|
30 |
0.0636ƒ1.337
|
100 - 300 |
27.5 |
0.0729 |
0.2 |
30 |
30 |
300 - 3 000 |
|
|
ƒ/1 500 |
30 |
|
3 000 - 15 000 |
|
|
ƒ/1 500 |
90 000/ƒ |
|
15 000 - 300 000 |
|
|
10 |
616000/ƒ1.2
|
|
| Notes:
* The exposure values in terms of electric and magnetic field strengths
are the values obtained by spatially averaging values over an area equivalent
to the vertical cross-section of the human body (projected area).
+ These plane-wave equivalent power density values, although not appropriate
for near-field conditions, are commonly used as a convenient comparison
with MPEs at higher frequency and are displayed on some instruments in
use. |
Reference: 410 NASA-STD-3000 514
Figure 5.7.3.2.1-2 Occupational
Exposure Limits for Radio frequency Electromagnetic Fields
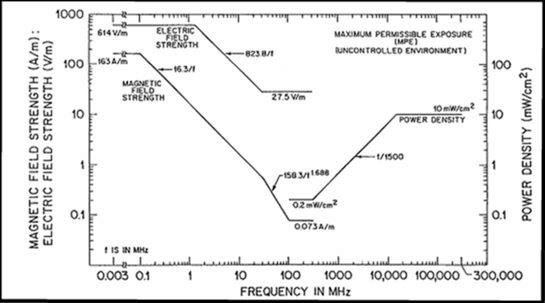
Reference: 410; NASA-STD-3000 513
Figure 5.7.3.2.1-3 Alpha-minimums used to determine "Point Source"
or "Extended Source" Laser Exposures
|
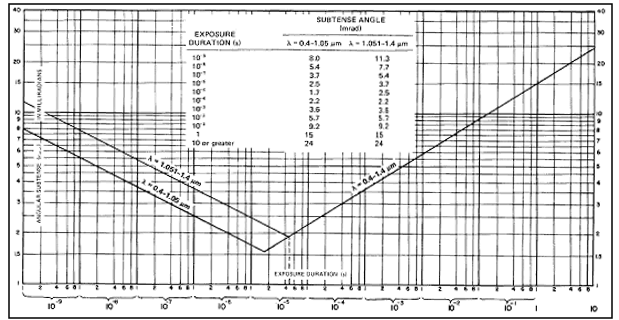
Note: Extended sources have an angular subtense or apparent visual
angle ≥ qmin. Angular
subtenses (apparent visual angles) < amin are considered intrabeam
viewing.
|
Reference: 383, Figure 3; NASA-STD-3000 429
Figure 5.7.3.2.1-4 Point Source Laser Eye Exposure Limits
Wavelength, λ
(µm) |
Exposure Duration, t
(s) |
Maximum Permissible Exposure
(MPE) |
Notes for Calculation and Measurement |
|---|
| Ultraviolet |
| 0.200--0.302 |
10-9- 3 × 10⁴ |
3 × 10⁻³ J · cm-2 |
or 0.56t¼ J · cm-2,
whichever is lower.
1-mm limiting
aperture |
| 0.303 |
10-9 - 3 × 10⁴ |
4 × 10⁻³ J · cm-2 |
| 0.304 |
10-9 - 3 × 10⁴ |
6 × 10⁻³ J · cm-2 |
| 0.305 |
10-9 - 3 × 10⁴ |
1.0 × 10⁻³ J · cm-2 |
| 0.306 |
10-9 - 3× 10⁴ |
1.6 × 10⁻³ J · cm-2 |
| 0.307 |
10-9 - 3 × 10⁴ |
2.5 × 10⁻³ J · cm-2 |
| 0.308 |
10-9- 3 × 10⁴ |
4.0 × 10⁻³ J · cm-2 |
| 0.309 |
10-9 - 3 × 10⁴ |
6.3 × 10⁻³ J · cm-2 |
| 0.310 |
10-9 - 3 × 10⁴ |
1.0 × 10⁻³ J · cm-2 |
| .0311 |
10-9 - 3 × 10⁴ |
1.6 × 10⁻³ J · cm-2 |
| .0312 |
10-9 - 3 × 10⁴ |
2.5 × 10⁻³ J · cm-2 |
| .0313 |
10-9 - 3 × 10⁴ |
4.0 × 10⁻³ J · cm-2 |
| .0314 |
10-9 - 3 × 10⁴ |
6.3 × 10⁻³ J · cm-2 |
| .0315 - 0.400 |
10-9 - 3 × 10⁴ |
0.56t ¼ J · cm-2 |
| .0315 - 0.400 |
10- 3 × 10⁴ |
1 J · cm-2 |
| Visible and Near Infrared |
| 0.400 - 0.700 |
10-9 - 1.8 × 10⁻⁵ |
5 × 10⁻⁷ J · cm-2 |
7 - mm limiting aperture
|
| 0.400 - 0.700 |
1.8 × 10⁻⁵ - 10 |
1.8t3/4 × 10-3 J · cm-2
|
| 0.400 - 0.550 |
10 - 104 |
10 × 10-3 J · cm-2 |
| 0.550 - 0.700 |
10 - T1 |
1.8t3/4 × 10-3 J · cm-2
|
| 0.550 - 0.700 |
T1 - 104 |
10CB × 10-3 J · cm-2
|
| 0.550 - 0.700 |
104 -3 × 10⁴ |
CB × 10-6 W · cm-2
|
| 0.400 - 0.700 |
10-9 -1.8 × 10⁻⁵ |
5CA × 10-7 J · cm-2
|
| 0.700 - 0.1050 |
1.8 × 10⁻⁵ - 10 |
1.8 CA t3/4 × 10-3 J
· cm-2 |
| 0.700 - 0.1050 |
10-9 -5 × 10⁻⁵ |
5 × 10⁻⁶ J · cm-2 |
| 1.051 - 1.400 |
5 × 10⁻⁵ - 103 |
9t3/4 × 10-3 J · cm-2
|
| 1.051 - 1.400 |
103 - 3 × 10⁴ |
320CA × 10-6 J · cm-2
|
| Far Infrared |
| 1.4-103 |
109 - 104 |
10-2 J · cm-2 |
|
| 107 - 10 |
0.56t1/4 J · cm-2 |
| >10 |
0.1 W · cm-2 |
| 1.54 only |
10-9 - 10-6 |
1.0 J · cm-2 |
| Notes:
CA = 1 for λ = 0.400 - 0.700 mm,
CA = 102.0 (λ - 0.700) for λ = 0.700
- 1.050 µm
CA = 5 for λ = 1.050 - 1.400 µm,
CB = 1 for λ = 0.400 - 1.550 µm,
CB = 1015(l -0.550) for λ = 0.550 - 0.700
µm
T1 = 10 × 1020(λ - 0.550) for λ
= 0.550 - 0.700 µm |
Reference: 383, Table 5 With Updates NASA-STD-3000 424
Figure 5.7.3.2.1-5 Extended
Source Laser Eye Exposure Limits
Wavelength, λ
(µm) |
Exposure Duration, t
(s) |
Maximum Permissible Exposure
(MPE) |
Notes for Calculation and Measurement |
| Ultraviolet |
| 0.200--0.302 |
10-9 - 3 × 10⁴ |
3 × 10⁻³ J · cm-2 |
For Ultraviolet, use these values or 0.56t ¼ J ·
cm-2,
whichever is lower.
1 - mm limiting aperture
|
| 0.303 |
10-9 - 3 × 10⁴ |
4 × 10⁻³ J · cm-2 |
| 0.304 |
10-9 - 3 × 10⁴ |
6 × 10⁻³ J · cm-2 |
| 0.305 |
10-9 - 3 × 10⁴ |
1.0 × 10⁻³ J · cm-2
|
| 0.306 |
10-9 - 3 × 10⁴ |
1.6 × 10⁻³ J · cm-2
|
| 0.307 |
10-9 - 3 × 10⁴ |
2.5 × 10⁻³ J · cm-2
|
| 0.308 |
10-9 - 3 × 10⁴ |
4.0 × 10⁻³ J · cm-2
|
| 0.309 |
10-9 - 3 × 10⁴ |
6.3 × 10⁻³ J · cm-2
|
| 0.310 |
10-9 - 3 × 10⁴ |
1.0 × 10⁻³ J · cm-2
|
| .0311 |
10-9 - 3 × 10⁴ |
1.6 × 10⁻³ J · cm-2
|
| .0312 |
10-9 - 3 × 10⁴ |
2.5 × 10⁻³ J · cm-2
|
| .0313 |
10-9 - 3 × 10⁴ |
4.0 × 10⁻³ J · cm-2
|
| .0314 |
10-9 - 3 × 10⁴ |
6.3 × 10⁻³ J · cm-2
|
| .0315 |
10-9 - 104 |
0.56t ¼ J · cm-2 |
| .0315 |
10 - 3 × 10⁴ |
1 J · cm-2 |
| Visible * |
| 0.400-0.700 |
10-9 × 10⁻⁵ - 10 |
10t1/3 J · cm-2 · sr-1
|
1 - mm limiting aperture or a min, whichever is
greater |
| 0.400-0.550 |
10 - 104 |
21t J · cm-2 · sr-1
|
| 0.550-0.700 |
10 - T1 |
3.83t3/4 J · cm-2 ·
sr-1 |
| 0.550-0.700 |
T1 - 104 |
21CB J · cm-2 · sr-1
|
| 0.400-0.700 |
104 - 3 × 10⁴ |
21CB 10-3 W · cm-2
· sr-1 |
| Near Infrared |
| 0.700 - 1.400 |
10-9 - 10 |
10CAt1/3 J · cm-2
· sr-1 |
|
| 0.700 - 1.400 |
10 - 103 |
3.83CAt3/4 J · cm-2
· sr-1 |
| 0.700 - 1.400 |
103 - 3 × 10⁴ |
0.64CA W · cm-2 · sr-1
|
| Far Infrared |
| 1.4-103 |
10-9 - 10-7 |
10-2 J · cm-2 |
|
| 10-7 - 10 |
0.56t1/4 J · cm-2 |
| >10 |
0.1 W · cm-2 |
| 1.54 only |
10-9 - 10-6 |
1.0 J · cm-2 |
| Notes:
CA = 1 for λ = 0.400 - 0.700 mm,
CA = 102.0 (λ - 0.700) for λ = 0.700
- 1.050 µm
CA = 5 for λ = 1.051 - 1.400 µm,
CB = 1 for λ = 0.400 - 1.550 µm,
CB = 1015(l -0.550) for λ = 0.550 - 0.700
µm
T1 = 10 × 1020(λ - 0.550) for λ
= 0.550 - 0.700 µm
|
Reference: 383, Table 6 With Updates NASA-STD-3000 425
Figure 5.7.3.2.1-6 Maximum Permissive
Exposure (MPE) for Skin Exposure to a Laser Beam
Wavelength, λ
(µm) |
Exposure Duration, t
(s) |
Maximum Permissible Exposure
(MPE) |
Notes for Calculation and Measurement |
| Ultraviolet |
| 0.200--0.302 |
10-9- 3 × 10⁴ |
3 × 10⁻³ J · cm-2 |
For Ultraviolet, use these values or 0.56t ¼ J × cm-2,
whichever is lower.
1 - mm limiting aperture.
|
| 0.303 |
10-9 - 3 × 10⁴ |
4 × 10⁻³ J · cm-2 |
| 0.304 |
10-9 - 3 × 10⁴ |
6 × 10⁻³ J · cm-2 |
| 0.305 |
10-9 - 3 × 10⁴ |
1.0 × 10⁻³ J · cm-2
|
| 0.306 |
10-9 - 3 × 10⁴ |
1.6 × 10⁻³ J · cm-2
|
| 0.307 |
10-9 - 3 × 10⁴ |
2.5 × 10⁻³ J · cm-2
|
| 0.308 |
10-9 - 3 × 10⁴ |
4.0 × 10⁻³ J · cm-2
|
| 0.309 |
10-9 - 3 × 10⁴ |
6.3 × 10⁻³ J · cm-2
|
| 0.310 |
10-9 - 3 × 10⁴ |
1.0 × 10⁻³ J · cm-2
|
| .0311 |
10-9 - 3 × 10⁴ |
1.6 × 10⁻³ J · cm-2
|
| .0312 |
10-9 - 3 × 10⁴ |
2.5 × 10⁻³ J · cm-2
|
| .0313 |
10-9 - 3 × 10⁴ |
4.0 × 10⁻³ J · cm-2
|
| .0314 |
10-9 - 3 × 10⁴ |
6.3 × 10⁻³ J · cm-2
|
| .0315 |
10-9 - 104 |
0.56t¼ J · cm-2 |
| 0.315 - 0.400 |
10-3 × 10⁴ |
1 J · cm-2 |
| Visible and Near Infrared |
| 0.400 - 1.400 |
10-9 - 10-7 |
2 CA × 10-2 J · cm-2
|
1 - mm limiting aperture |
| |
10-7 - 10 |
1.1 CA t1/4 J · cm-2
|
| |
10 - 3 × 10⁴ |
0.2 CA W · cm-2 |
| Far Infrared |
| 1.4-103 |
10-9 - 10-7 |
10-2 J · cm-2 |
1-mm limiting aperture for 1.4 to 100 mm.
11-mm limiting aperture for 0.1 to 1 mm |
| 10-7 - 10 |
0.56t1/4 J · cm-2 |
| >10 |
0.1 W · cm-2 |
| 1.54 only |
10-9 - 10-6 |
1.0 J · cm-2 |
|
Reference: 383, Table 7 With Updates NASA-STD-3000 426
Figure 5.7.3.2.1-7 Intrabeam
MPE for the Eye and Skin for Selected CW Lasers
| Laser Type |
Primary Wavelength (nm) |
Exposure Limit |
| Eye |
Skin |
| Helium - Cadmium |
441.6 |
a) 2.5 mW · cm-2 for 0.25 s |
0.2 W · cm-2 for t >
10 s |
| Argon |
488/514.5 |
b) 10 mJ · cm-2 for 10 to 104 s |
| c) 1 mW · cm-2 for t > 104 s |
| Helium - Neon |
632.8 |
a) 2.5 mW · cm-2 for 0.25 s |
0.2 W · cm-2 for t >
10 s |
| b) 10 mJ · cm-2 for 10 s |
| c) 170 mJ · cm-2 for t > 453 s |
| d) 17 mW · cm-2 for t > 104 s |
| Krypton |
647 |
a) 2.5 mW · cm-2 for 0.25 s
b) 10 mJ × cm-2 for 10 s
c) 280 mJ · cm-2 for t > 871 s
d) 28 mW · cm-2 for t > 104 s |
0.2 W · cm-2 for t > 10 s |
| Neodymium: YAG |
1,064 |
1.6 mW · cm-2 for t > 1000 s |
1.0 W · cm-2 for t > 10 s |
Gallium - Arsenide
at room temp |
905 |
0.8 mW · cm-2 for t > 1000 s |
0.5 W · cm-2 for t > 10 s |
| Helium - Cadmium |
325 |
1 J · cm-2 for 10 to 3 × 10⁴ s |
a) 1 J · cm-2 for 10 to 1000 s |
| Nitrogen |
337.1 |
|
b) 1 mW · cm-2 for t > 1000 s |
Carbon - dioxide
(and other lasers
1.4 mm to 1000 mm) |
10,600 |
0.1 W · cm-2 for t > 10 s |
0.1 W · cm-2 for t > 10 s |
Reference: 383, Table A3 NASA-STD-3000 427, Rev. A
Figure 5.7.3.2.1-8 TLVs for
Radiant Exposure of Actinic UV upon Unprotected Skin or Eye
| Wavelength (nm) |
TLV (mJ/cm2) |
Relative Spectral Effectiveness
Sl |
| 200 |
100 |
0.03 |
| 210 |
40 |
0.075 |
| 220 |
25 |
0.12 |
| 230 |
16 |
0.19 |
| 240 |
10 |
0.30 |
| 250 |
7.0 |
0.43 |
| 254 |
6.0 |
0.50 |
| 260 |
4.6 |
0.65 |
| 270 |
3.0 |
1.0- |
| 280 |
3.4 |
0.88 |
| 290 |
4.7 |
0.64 |
| 300 |
10 |
0.30 |
| 305 |
50 |
0.06 |
| 310 |
200 |
0.015 |
| 315 |
1000 |
0.003 |
| Notes:
*See Laser TLVs.
See below for applicable notes |
Reference: 385,
pp. 106 - 107NASA-STD-3000 421z, Rev. A
| Duration of Exposure Per Day |
Effective Irradiance Eeff (mW/cm2)
|
|---|
|
8 hrs
|
0.1
|
|
4 hrs
|
0.2
|
|
2 hrs
|
0.4
|
|
1 hr
|
.0.8
|
|
30 min
|
1.7
|
|
15 min
|
3.3
|
|
10 min
|
5
|
|
5 min
|
10
|
|
1 min
|
50
|
|
30 sec
|
100
|
|
10 sec
|
300
|
|
1 sec
|
3,000
|
|
0.5 se
|
6,000
|
| 0.1 sec |
30,000
|
|
Note: For Figure 5.7.3.2.1-8 TLVs for Radiant Exposure of Actinic UV upon Unprotected Skin or Eye and
5.7.3.2.1-9 Permissible Ultraviolet Exposures.
|
Reference: 385, pp. 106 - 107; NASA-STD-3000422z, Rev. A
|
Notes for Figure 5.7.3.2.1-8 TLV's for Radiant Exposure of Actinic UV upon
Unprotected Skin or Eye and Figure 5.7.3.2.1-9 Permissable Ultraviolet Exposures.
ULTRAVIOLET RADIATION
These Threshold Limit Values (TLVs) refer to Ultraviolet radiation in the spectral region between 200 and 400 nm and represent conditions under which it is believed that nearly all workers may be repeatedly exposed without adverse effect. These values for exposure of the eye or the skin apply to ultraviolet radiation from arcs, gas and vapor discharges, fluorescent and incandescent sources, and solar radiation, but do not apply to ultraviolet lasers.* These values do not apply to ultraviolet radiation exposure of photosensitive individuals or of individuals concomitantly exposed to photosensitizing agents. These values should be used as guides in the control of exposure to continuous sources where the exposure duration shall not be less than 0.1 sec.
These values should be used as guides in the control of exposure to ultraviolet sources and should not be regarded as a fine line between safe and dangerous levels.
Recommended Values:
The threshold limit value for occupational exposure to ultraviolet radiation incident upon skin or eye where irradiance values are known and exposure time is controlled are as follows:
1. For the near ultraviolet spectral region (320 to 400 nm) total irradiance incident upon the unprotected skin or eye should not exceed 1 mW/cm2 for periods greater than 103 seconds (approximately 16 minutes) and for exposure times less than 103 seconds should not exceed one J/cm2.
2. For the actinic ultraviolet spectral region (200-315 nm), radiant exposure incident upon the unprotected skin or eye should not exceed the values given in
Figure 5.7.3.2.1-8 within an 8-hour period.
3. To determine the effective irradiance of a broadband source weighted against the peak of the spectral effectiveness curve (270 nm), the following weighting formula should be used:
Eeff=S
El
Sl Dl
Where:
Eeff = effective irradiance relative to a monochromatic source at 270 nm in W/cm2 (J/s/cm2)
El = spectral irradiance in W/cm2/nm
Sl = relative spectral effectiveness (unitless)
Dl = band width in nanometers
4. Permissible exposure time in seconds for exposure to actinic ultraviolet radiation incident upon the unprotected skin or eye may be computed by dividing 0.003 J/cm2 by
Eeff in W/cm2.
* See Laser Exposure Limits
|
Reference: 385; NASA-STD-3000 431, Rev. B
Figure 5.7.3.2.1-10 Spectral
Weighting Functions for Assessing Retinal Hazards from Broad-Band Optical Sources
| Wave length (nm) |
Blue-Light Hazard-Function Bl |
Burn Hazard Function Rl |
|
400
|
0.10
|
1.0
|
|
405
|
0.20
|
2.0
|
|
410
|
0.40
|
4.0
|
|
415
|
0.80
|
8.0
|
|
420
|
0.90
|
9.0
|
|
425
|
0.95
|
9.5
|
|
430
|
0.98
|
9.8
|
|
435
|
1.0
|
10.0
|
|
440
|
1.0
|
10.0
|
|
445
|
0.97
|
9.7
|
|
450
|
0.94
|
9.4
|
|
455
|
0.90
|
9.0
|
|
460
|
0.80
|
8.0
|
|
465
|
0.70
|
7.0
|
|
470
|
0.62
|
6.2
|
|
475
|
0.55
|
5.5
|
|
480
|
0.45
|
4.5
|
|
485
|
0.40
|
4.0
|
|
490
|
0.22
|
2.2
|
|
495
|
0.16
|
1.6
|
|
500-600
|
10 [(450-l)/50]
|
10
|
|
600-700
|
0.001
|
1.0
|
|
700-1050
|
NA*
|
10[(700 -l)/500)
|
|
1050-1400
|
NA
|
0.2
|
|
Note: NA = Not applicable
|
Reference: 385, p. 111 NASA-STD-3000 423
5.7.3.2.2 Non-Ionizing Radiation Protection Design Requirements
{A}
The following design requirements shall be implemented to protect crewmembers against non-ionizing radiation:
a. Safety Guidelines - Systems employing lasers will be designed and operated in accordance with the ANSI Standard Z136.1 - 1986 except where the unique environment or mission requirements clearly makes it unreasonable to do so. The hazard analysis for a system will specifically address any instance where it does not meet the standard.
b. RF and Optical Radiation Monitoring - Based on the identified sources of RF and optical radiation, monitoring and warning systems shall be provided consistent with the potential hazard from each source.
c. Procedures for RF and Optical Sources - Procedures for the safe operation of RF and optical radiation sources shall be provided. Based on the mission plans, the possibility of providing automatic power shutoff for the hazardous RF and optical radiation equipment shall be considered.
d. Protective Measures - Procedures and equipment shall be provided to enable positive protective measures to be taken to prevent accidental exposures from RF and optical radiation.
e. Personnel Protection Devices - Based on the safety guidelines and the results of the electromagnetic hazards analysis (see
paragraph 5.7.3.1.4), personnel protective device requirements (eyewear, clothing) shall be established and the requisite personnel equipment shall be provided.
5.8 THERMAL ENVIRONMENT
{A}
5.8.1 Introduction
{A}
This section provides design considerations and requirements for temperature, humidity, and airflow conditions that influence crew comfort. This includes descriptions of ambient conditions, body temperature, self-regulation, heat stress, cold stress, and ventilation. Monitoring and control of the thermal environment are also included.
Refer to Paragraph 6.5, Touch Temperature, for surface temperature design considerations and requirements.)
5.8.2 Thermal Environment Design Considerations
{A}
The productivity of the crew of a space module is strongly influenced by their comfort and health. The thermal environment is one of the most significant factors of those that determine crew comfort.
Human life can be maintained in extreme environments ranging from Arctic cold to equatorial heat. The critical variable for survival is exposure time, which, for example, may range from seconds for third degree burns to days for fatal dehydration in desert heat. Thermal effects can be moderated by properly chosen clothing. Differences between individuals in response to thermal extremes are pronounced, largely due to variations in the length of adaptive period, called acclimatization. Selection and training can influence response to any particular environment/activity/ clothing combination.
The cabin heating, circulation, and cooling systems need to be designed to maintain human comfort by controlling the atmospheric parameters of gas temperature, velocity, pressure, and humidity. Radiant heat sources must be identified and their impact on comfort assessed and controlled. The combined effects of these factors in conjunction with metabolic level and clothing worn by the crew (factors that affect skin temperature and sweat rate) largely determine comfort level. Thermal comfort definitions are discussed in
Paragraph 5.8.2.2.
For many years, physiologists have sought to model the thermal environment as a single equation written as a combination of two or more factors that would accurately describe the thermal stress on humans. Frequently used thermal environmental indices include the following:
a. Dry Bulb (DB) Temperature - This is the temperature of the bulk of the air in a given environment as measured by an ordinary thermometric method.
b. Wet Bulb (WB) Temperature - This is the dynamic equilibrium temperature attained by a water surface when exposed to air under adiabatic conditions (i.e., no gain or loss of heat by the surroundings), so that the sensible heat transferred from the gas to the liquid is equal to the latent heat carried away by evaporation of water vapor into the gas.
c. Wet/Dry (WD) Index - This is defined by the equation WD - 0.85WB + 0.15DB, where either degrees F or degrees C can be used. In the absence of radiant heat and no air movement, WD is an excellent predictor of conditions stressful to humans, especially in environments having relative humidity over 50%. The WD index has often been used as a measure of heat tolerance time.
d. Effective Temperature (ET) - This is an empirical sensory index that takes into account the effects of temperature, humidity, and air movement. It is a function of DB, WB, and air velocity, as shown in
Figure 5.8.2-1.
e. Globe Temperature (GT) and Wet Bulb Globe Temperature (WBGT) - The globe temperature is determined by placing a thermometer or temperature sensor in the center of a sphere 10 - 15 cm (3.9 - 5.9 in) in diameter. The sphere is constructed of thin metal, blackened for high absorptivity over the solar and infrared spectrum. The temperature inside the globe is a physical composite of DB, radiation, and convection. The GT becomes truly predicative over a wide range of environments when weighted with wet and dry bulb temperature as follows:
WGBT = 0.7WB + 0.2DB, either degrees F or degrees C.
This index is easy and inexpensive to determine and is usable over a wide range of indoor and outdoor temperatures.
f. Mean Radiant Temperature (Tmrt) - In relation to a given human placed at a given point with a given body position and given clothing, the Tmrt is defined as the uniform temperature of a black enclosure which would give the same heat loss by radiation from the enclosure as from the human.
g. Predicted four-hour Sweat Rate (P4SR) - This is determined from empirical nomograms incorporating environmental factors, work rate, and clothing, as shown in
Figure 5.8.2-2. It is recommended that the P4SR not be used for predicting sweat rate, but, rather, be used for comparing environments in terms of thermal stress. The limitations of this nomogram are chiefly those of a narrow range of activity, limited clothing parameters, and the fact that the subjects used to generate the data were all acclimatized to the heat environment.
h. Insulation Value of Clothing (Icl) - This is a dimensionless expression for the total heat transfer resistance from skin to the outer surface of the clothed body. Icl is defined by,
Icl - (Rcl/0.18) (Clo)
where Rcl = the total heat transfer resistance from skin to the outer surface of the clothed body measured in m2-hr-°C/kcal (ft2-hr-oF/BTU). Clo is defined in
Figure 5.8.2-3.
See Figure 5.8.2-4 and 5.8.2-5 for information to determine total body surface and total body heat radiation area respectively based on height and weight.
Air velocity and activity level are two other principal variables associated with thermal comfort.
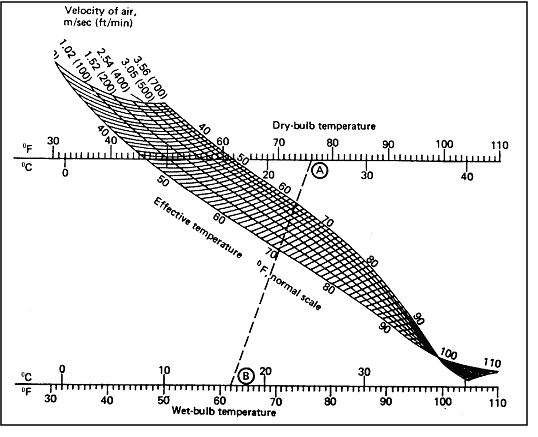
Applicability:
Applicable to inhabitants of the United States under the following
conditions: 1) Clothing: Customary indoor clothing; 2) Activity:
Sedentary or light muscular work; 3) Heating methods: Convection type.
Example of the use of the chart:
Given dry bulb temperature of 76°F, wet bulb temperature of 62°F, velocity
of air 100 fpm, determine: 1) effective temperature (ET) of the condition.
2) ET with still air; 3) cooling produced by the movement of the air; 4)
velocity necessary to produce the condition of 66°F ET.
Solution:
1) Draw line A-B through given dry and wet bulb temperatures. Its
intersection with the 100 fpm curve gives 69°F for the ET of the
condition. 2) Follow line A-B to the right to its intersection with the 20
fpm velocity line, and read 70.4°F for the ET for this velocity or so-called
still air. 3) The cooling produced by the movement of the air is 70.4 -
69.0 = 1.4°F ET. 4) Follow line A-B to the left until it crosses the
66°F ET line. Interpolate velocity value of 340 fpm to which the movement
of the air must be increased for maximum comfort.
|
Reference: 9, Figure 6-7, p. 6-13; NASA-STD-3000 128
Figure 5.8.2-2 Nomograph for the
Prediction of a 4 hour Sweat Loss (PRSR)
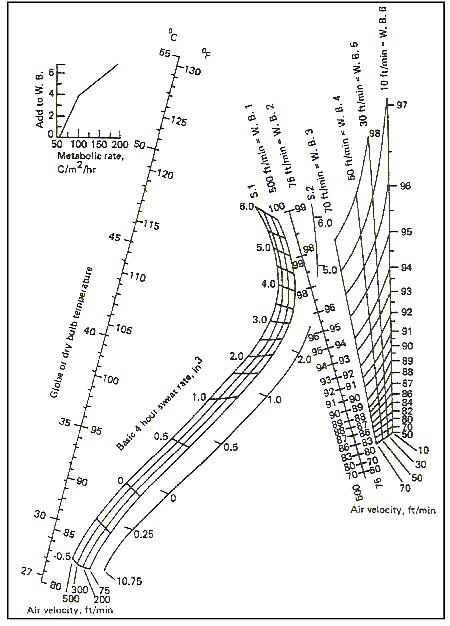
Reference: 9, Figure 6-76, p. 6-94; NASA-STD-3000
129
Figure 5.8.2-3 Physiological and
Thermal Characteristics of An Average Man (Cont)
| Characteristic |
Metric Units |
English Units |
| Whole Body Data |
| Weight |
68 - 72 kg |
150 - 160 lbs |
| Height |
170 cm |
68 - 69 in |
| Total body surface area |
1.8 m2 |
19.5 ft2
|
| Volume |
0.07 m3 °C |
2.5 ft3 |
| Specific Heat |
0.8 cal/gm- °C
|
0.8 Btu/lb- °F |
| Heat capacity (using 160 lb man) |
57.8 cal/ °C
|
128 Btu/ °F |
| Body temperature (rectal) |
37 °C
|
98.6 ± 0.5 °F |
| Body surface temperature |
33 - 34 °C
|
90 - 93 °F |
| Body and clothing surface temperature (ave. - 1
Clo) |
28 °C
|
82.2 °F |
| Body temperature (2/3 tc + 1/3 ts) |
35.6 °C
|
96.1 °F |
| Body percent water |
70 % |
70 % |
| Skin Characteristics |
| Weight |
4.0 kg |
8.8 lbs |
| Surface Area |
1.8 m2 |
19.5 ft2
|
| Volume |
3.6 liters |
3.7 quarts |
| Water Content |
70 - 75% |
70 - 75 % |
| Specific Gravity |
1.1 |
1.1 |
| Thickness |
0.5 mm (eyelids) to 6 mm (back) |
0.02 to 0.2 in |
| Heat production |
13% (body's metabolic heat production) |
13 % |
| Conductance |
9 → 30 kg Cal/m2-hr-°C
|
|
| Thermal conductivity (K) |
(1.5 ± 0.3) 10-3 cal/cm-sec-°C at
23 - 25 °C ambient |
|
| Diffusivity (k/p
Cp) |
7x10⁻⁴ cm2/sec (surface layer 0.26 mm
thck) |
|
| Thermal inertia (k/p Cp)
|
90 -400x10-5 cal2/cm4-sec-°C2 |
|
| Heat capacity (Cp)
|
0.8 cal/gm °C2 |
0.8 Btu/lb °F |
| Emissivity (infrared) |
-0.99 |
|
| Skin and clothing |
-0.94 |
|
| Reflectance (wave length dependent) |
Max. 0.5 → 1.1μ
Min. 0.3 and 1.2μ
|
|
| Transmittance (wave length dependent) |
Max. 1.2, 1.7, 2.2, 6, 11μ
Min. 0.5, 1.4, 1.9, 3, 7, 12μ |
|
| Term |
Definition
|
| Clo |
Insulation value of that quantity of clothing
that will maintain comfortable thermal equilibrium in a man sitting at
rest in an environment of: (a) 70 °F air and wall
temperature, (b) less than 50% rel. humidity, and (c) 20 ft/min air
movement |
|
1 Clo =
|
0.18 °C /
kg-cal/hr
|
In combined units
for 1.8 m2 surface area |
|
1 Clo =
|
0.04536 °F /
Btu/hr
|
(1 kg-cal = 3.968 Btu) |
| Tb |
Weighted mean body temperature |
| Tc |
Body internal (rectal) temperature |
| Ts |
Mean Skin Temperature |
| Heat capacity of Body periphery |
40 Btu/ °F
|
Outer layer to skin as opposed to body cores.
Approximately 1.0 inches thick/ |
| Resistance of periphery |
Function of body activity and is equivalent to 0.16 to 0.70
Clo |
| Pain threshold for any area of skin |
45°C (113 °F) |
| When mean weighted skin temperature is:
|
The typical sensation is: |
| Above 35 °C
(95 °F) |
Unpleasantly warm |
| Above 34 °C
(93 °F) |
Comfortably warm |
| Below 31 °C
(88 °F) |
Uncomfortably cold
|
| Below 30 °C
(86 °F) |
Shivering cold
|
| Below 29 °C
(84 °F) |
Extremely cold |
| When hands reach: |
When feet reach: |
They feel: |
20 °C
(68 °F) |
23°C
(73.4 °F) |
Uncomfortably cold
|
15 °C
(59 °F) |
18°C
(64.5 °F) |
Extremely cold
|
10 °C
(13 °F) |
13°C
(55 °F) |
Painful and numb |
Reference: 78, Figure I-205, p. 6; NASA-STD-3000 130b
Figure 5.8.2-4 Nomogram to Determine
Total Human Body Surface from Height and Weight
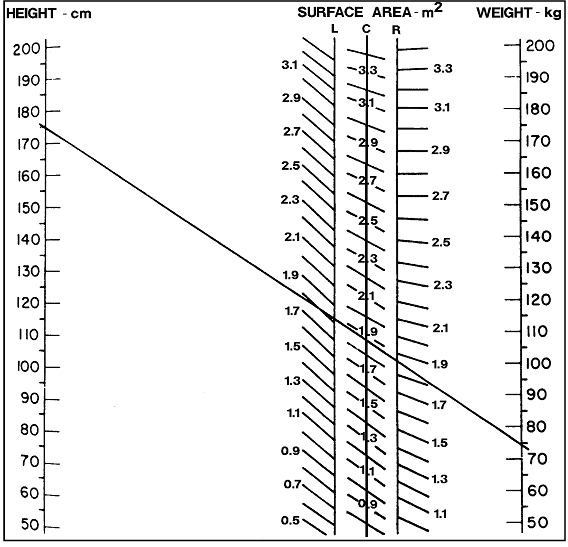
Example:
To find the surface area of a male of mean height and weight (175.5 cm, 74.4
kg), a straight line is drawn between the two appropriate points on the H and W
scales. The slope of the line most nearly approximates the slope of the
C-scale bar. The surface area of such an individual is approximately 1.9 m2.
|
Reference: 142, p. 257; NASA-STD-3000 406
Figure 5.8.2-5 Information to Determine
Total Body Heat Radiation Area Based on Height and Weight
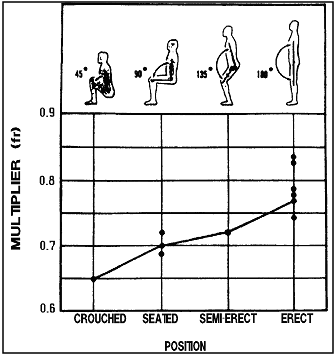
Since the total radiation area of the body varies with position, the diagram
shows what multiplier (fr) to use with total body surface area for
each of four common positions. For the nude body, the following steps are
involved:
(1) Find the total surface area (S.A.) by:
S.A. (in ft2) = 0.108 W0.425 x H0.725
where W is weight in pounds and H is height in inches: or
S.A. (in m2) = 0.007184 W0.425 x H0.725
where W is weight in kg and H is height in cm (or use the nomogram, 14-12)
(2) Then, to find the total radiation area (Ar) for a given
position,
Ar = S.A. x fr
Ar is increased by clothing, but each assembly will add its own
increment. A standard set of light street clothing increases Ar
by 1.14.
|
Reference: 142, p. 158; NASA-STD-3000 407
5.8.2.1 Mission Thermal Environment Design Considerations
{A}
Certain mission phases will require special provisions in order to maintain crew thermal comfort:
a. Prelaunch - While loading the spacecraft, the cabin may be exposed to the ambient thermal environment, and maintaining strict thermal control may not be necessary or feasible.
b. Launch - The cabin atmosphere parameters of pressure, composition, air velocity, temperature, and humidity must be automatically maintained within specified limits.
c. Long Flights - Discomfort will tend to be more of a problem as mission length increases. The activities expected will likely be more varied and include a variety of levels of physical activity, including mandatory physical exercise. Under microgravity conditions, sweat does not drip from the body but tends to sheet on the skin and also form ringlets around the neck. Therefore, sweat removal and collection is required in the exercise are.
d. Experiment Performance - Some experiments are likely to be sensitive to the thermal environment and require special thermal control.
e. Entry - The same considerations as described for launch apply here. The thermal management system must be capable of handling the entry heat loads.
f. Post-Landing - Considerations include the delay until egress, adverse thermal environments, and a possible non-venting requirement of the internal (cabin) environment.
5.8.2.2 Human Responses to Thermal Environments Design Considerations
{A}
Thermal comfort can be defined several ways. The simplest is that condition of mind which expresses satisfaction with the thermal environment.
The primary physiological parameters related to human thermal response are skin temperature (ts), internal or core temperature (tc), and weighted mean body temperature (tb). The desired circumstance is to have the body at a state of equilibrium with the environment in a condition that is comfortable, as defined above.
Comfort for humans is a subjective condition; however, thermal comfort has been mathematically defined. It is the condition in which the body core temperature is normal and the rate of body heat storage is zero. A thermal comfort equation has been developed that is based primarily on mean skin temperature (ts) and sweat secretion as a function of activity level:
Heat Conduction Through Clothing = R + C = H - D - S - Rw - Rd; where R = heat loss by respiration; C = heat loss by convection; H = internal heat production; D = heat loss by skin diffusion; S = heat loss by sweat secretion; Rw = latent heat of respiration loss; and Rd = dry respiration heat loss.
Mathematical details for the above equation are given in Reference 332.
(Also refer to Paragraph 11.13.1, Clothing.)
The comfort zone is defined as that range of environmental conditions in which humans can achieve thermal comfort, and is affected by the work rate, clothing, and state of acclimatization.
Figure 5.8.2.2-1 is a graphic representation of the comfort zone. The comfort zone does not include the entire range of conditions in which humans can survive indefinitely: this is a larger zone that might require active sweating or shivering, responses initiated by elevated or lowered core temperatures. The graph implies minimal air movement and assumes the radiant temperature of the surroundings to be equal to the dry bulb temperature. The effects of acclimatization, work, and heavier clothing are shown as data trends by the arrows on the graph.
The mechanisms for thermal self-regulation and human responses to various environment are discussed in
Paragraphs 5.8.2.2.1 through 5.8.2.2.5.
5.8.2.2.1 Modes of Heat Exchange Design Considerations
{A}
Heat is exchanged between humans and the environment through four processes:
a. Radiation - Exchanges of radiation may occur with surfaces having higher or lower temperatures than that of the skin. Radiation may also be absorbed by the skin from high-temperature sources such as the Sun.
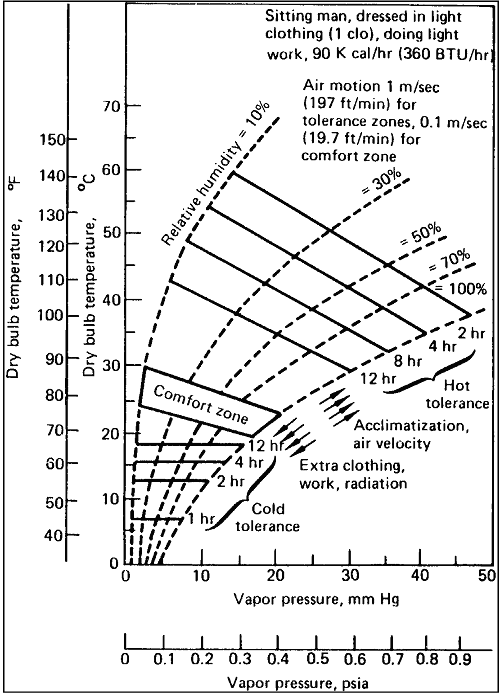
Reference: 19, subnote 7(1), p. 5; NASA-STD-3000 131
b. Convection - The body may exchange heat by air convection. This is an important source of heat loss, especially if the air velocity around the body is high and the air temperature is low.
c. Conduction - Heat may be exchanged by conduction with objects in direct contact with the body.
d. Vaporization - Heat may be lost by vaporization from the lungs through respiration and from the skin by sweating.
Heat is also lost in urine and feces. The body stores heat in the tissues and body fluids. This stored heat is the currency with which body heat balance is purchased.
5.8.2.2.2 Thermoregulation by the Body Design Considerations
{A}
The simplest and most accurate way of representing the body thermally is by the core-shell concept. In this view, the body core produces heat that is lost to the environment through the shell (skin). Using sensors in both the core and shell for information feedback, the body attempts to maintain the temperature of the core. The body has several techniques for generating or dissipating heat:
a. Heat Dissipation - When challenged by a hot environment, the body uses three methods, in combination, to dissipate the heat:
1. vasodilatation causes an increase in the blood flow to the skin. This increases the conductivity of the skin and increases the skin temperature, allowing a more rapid heat loss by convection and radiation from the body to the environment.
2. Sweating dissipates body heat by evaporation. If the environmental temperature is greater than the blood temperature, sweating is the only means by which the body can maintain its heat balance.
3. Behavior is an important factor. When a person gets uncomfortably warm, he attempts to cool off by moving to a cooler environment, decreasing physical activity, and seeking shade to avoid radiant heat sources.
b. Heat Generation - The three principal means of defense against cold are the following:
1. Vasoconstriction - The blood flow to the skin is reduced, increasing shell insulation and decreasing skin temperature, both of which reduce heat loss to the environment.
2. Thermogenesis - The body increases heat production by shivering.
3. Behavior - A cold person attempts to move to warmth, put on more clothing, engage in exercise, etc.
The consensus of physiologists is that a human can acclimate effectively to heat but not to cold. Under continued heat stress the body will develop higher sweat rates at lower skin temperatures, i.e., becomes more efficient in providing evaporative cooling. No comparable physiological acclimatizations have been detected for extended periods of cold stress. (Heat and cold acclimation is discussed further in
Paragraphs 5.8.2.2.3 and 5.8.2.2.4.)
c. Regulation During Work - When a person is engaged in physical activity, the body's regulatory system must consider three extra tasks: 1) the muscles produce extra heat that must be dissipated, 2) more blood flow must be supplied to the working muscles, and 3) the body develops higher core temperature (how high is dependent upon the workload). These factors usually interfere with thermo- regulation in the heat and assist it in the cold.
d. Environmental Factors Affecting Heat Exchange - Although the body can control its rate of heat transfer to the environment, the heat exchange itself is governed by physical laws. Therefore, the physical environment is important in its effect on transfer. Some environmental factors that influence heat exchange are:
1. Air temperature, which directly influences connective transfer and sweat evaporation.
2. Humidity, which has an important effect on sweat evaporation rate and insensible (respiratory and skin diffusion) water vapor loss.
3. Air velocity, which is an extremely important factor in convection and evaporation.
4. Radiation from the Sun and other sources, including sunlight reflected from the environment. Radiant heat effects on the body are also directly related to cabin wall surface temperatures.
5. Sensible and insensible water vapor loss rates are influenced by the vapor resistance of the clothing worn.
6. The connective heat transfer coefficient is affected by microgravity as described in
Paragraph 5.8.2.2.2.1.
5.8.2.2.2.1 Microgravity Effects on the Thermal Environment
{O}
The principal effect of a microgravity environment on heat transfer is the loss of natural convection, i.e., warmer air will not naturally rise. All convection under these conditions must be forced through the use of fans or blowers. In the steady-state heat balance equation, microgravity will only affect the connective heat transfer coefficient, hc. However, the forced convection heat transfer coefficient has been derived empirically for a 1-G gravity environment and hence includes a residual natural convection influence that must be subtracted before use under microgravity conditions. A development of the hc correction for microgravity has been detailed in Reference
332.
A heat-measuring device called an electric dynamic katathermometer (EDK) has been developed which automatically and continuously scans heat output from a surface, e.g., skin, chamber wall, or equipment surfaces. Results obtained with this device show that skin temperatures measured in microgravity differ markedly, both for rest and work situations, from those obtained under 1-G. These results showed a comparable increase in skin temperature of the chest and a decrease in the temperature of the extremities. Data obtained also indicated that the space chamber microgravity atmosphere has greater cooling capacity than did a similar test chamber on Earth.
5.8.2.2.3 Human Performance in Heat Design Considerations
{A}
Performing heavy work results in elevated skin temperature followed by elevated body core temperature. vasodilatation and sweating commence, but cannot completely compensate for the heat load on the body. As the core temperature continues to rise, the heart rate increases and eventually may reach 70 beats per minute (or more) above normal. As the body continues to store heat, the individual may suffer from heat exhaustion. This is characterized by hypertension, difficulty with breathing (dyspnea), confusion, and fainting.
A person performing moderate or heavy work will develop higher core temperatures before onset of heat exhaustion. Occasionally, people hard at work in the heat experience almost none of the above symptoms and suddenly faint or, in some rare instances, go directly into heat stroke.
Heat tolerance limits are usually defined in three ways:
Maximum Allowable Internal Temperature - About 39°C (102°F) for a resting or lightly working person, but can be above 40°C (104°F) for a person at hard work.
b. Maximum Allowable Heat Storage - About 2.7 kcal/ kg (4.9 BTU/lb) of body weight, or about 135 kcal/m2 (49.9 BTU/ft2) of body surface are. The body heat storage index (qs), is defined as the steady state rate of heat loss or gain to the body which results from imbalance in the biothermal equation:
Body Heat Storage Index, qs = 0.83 BW (tb -36), kcal where tb = 1/3 ts + 2/3 tc
BW = body weight in kilograms. If the rate of body temperature change is known, then the body heat storage index can be calculated. See
Paragraph 5.8.2.2 for symbol definitions.
c. Tolerance Times with Respect to Various Environmental Indices - Figure 5.8.2.2.3-1 shows the tolerance times plotted for three of the indices defined in
Paragraph 5.8.2.
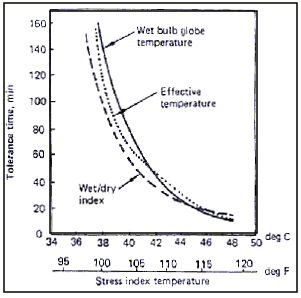
Reference: 19, Figure 2.2(1); NASA-STD-3000
292
5.8.2.2.4 Human Performance in Cold Design Considerations
{A}
In a cold stress situation, the body will rapidly reduce peripheral circulation in an attempt to conserve core heat. As the core and skin temperatures continue to drop, shivering begins and discomfort is continually present. Eventually shivering may become violent and uncontrollable. As the core continues to lose heat, shivering eventually lessens, then stops altogether. At this point, complete loss of thermoregulation is imminent. Death, however, may not come quickly. The core temperature can be drastically reduced, to 26°C (78.6 °F) or lower, with the body still surviving. With such extreme cooling of the core, death can occur when attempts are made to rewarm the body, cardiac fibrillation being the common cause of death.
A hypothermia victim becomes critical when the core temperature drops to about 35°C (95°F). The environmental indices used for heat exposure are not considered appropriate for cold because humidity is not a factor because air saturated at
0°C (32°F) holds only 1/5 of the water vapor as air saturated at 27°C (80°F). In the absence of high air velocity, the most widely used cold stress indicator is dry bulb temperature.
Figure 5.8.2.2.4-1 gives some approximate tolerance times in cold air environments, assuming no radiation effects and a fixed clothing insulation factor.
In cold air, even a moderate air velocity will dominate other modes of heat transfer from exposed skin (see the wind-chill indices in
Figure 5.8.2.2.4-2). Regardless of the air velocity, frostbite will not occur unless the true dry bulb is below 0°C. (32°F). In addition, the effect of moderate air velocity is only applicable to exposed skin; there is little effect on clothing up to velocities of 10-15 m/s, (32.8 - 49.2 ft/sec). Above this limit, the effects are complex; the principal danger is the formation of local cold spots on the exposed side of the body, resulting in excessive heat loss from small areas.
(Refer to Paragraph 11.13.1, IVA Clothing, for more details on clothing.)
If the surface temperature of the hand falls below 12° - 14°C (54° - 57°F), manipulative ability begins to fail. As the hand temperature drops lower, more serious loss of manipulation ability occurs, partly from stiffness and partly from the loss of tactual sensitivity. The final decrement is caused by the loss of brain functioning due to a drop in core temperature. The brain loses the capacity for cognitive functions if its temperature drops much below
34° - 35°C (93° - 95°F) even though the body is still capable of responding to instruction.
Figure 5.8.2.2.4-1 Human Tolerance
Times in Cold Environments
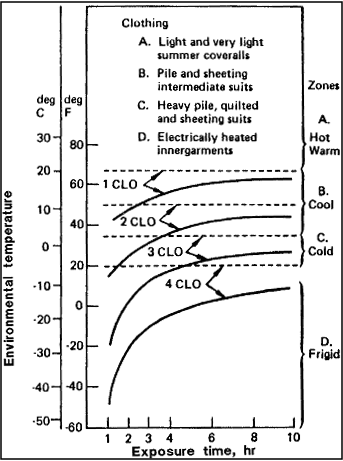
Notes:
A. Clothing in Zone A (Hot/Warm) - Light and very light summer coveralls.
B. Clothing in Zone B (Cool) - Pile and sheeting
intermediate suits.
C. Clothing in Zone C (Cold) - Heavy pile, quilted and
sheeting suits.
D. Clothing in Zone D (Frigid) - Electrically heated
innergarments.
|
Reference: 19, Figure
3.2(1); NASA-STD-3000 132
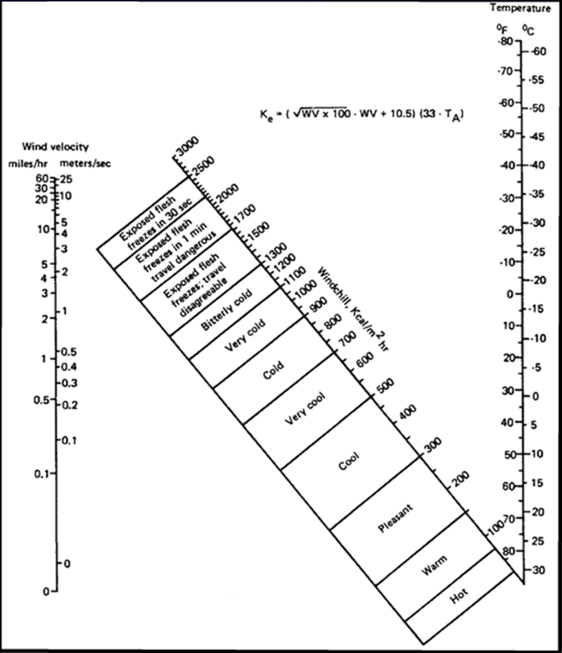
Note: The windchill index does not account for physiological
adaptations or adjustments and should not be used in a rigorous manner. It
is based on field measurements during World War II of the rate of cooling of a
container of water.
|
Reference: 19, Figure 3.3(1); NASA-STD-3000 133
5.8.2.2.5 Special Ventilation & Metabolic Heat Removal Design Considerations
{A}
The requirements for manned space module ventilation cannot be based on ground-based systems due to an absence of connective airflow. The primary reason for specifying air velocity limits is to extend the range of acceptable environments for the crewmembers.
The amount of air required in any region of the cabin depends on the number of crew present and on their work activity. The recommended amount of air for adults engaged in moderate physical activity ranges from 2.4 - 14.2 liters/ sec (5 to 30 ft3/min) per person, with approximately two-thirds of this being fresh revitalized air. The range of metabolic heat added to the module atmosphere is given in
Figure 5.8.2.2.5-1. This table shows the amount of heat generated by the crew which must be removed by the ECLSS.
Figure 5.8.2.2.5-1 Metabolic
Heat Generation Matrix (Cont.)
Metric Units
Metabolic Heat Generation Matrix
| Low metabolic load |
| Cabin temperature |
18°C |
21°C |
24°C |
|
Kcal/hr |
hrs |
Total |
Kcal/hr |
hrs |
Total |
Kcal/hr |
hrs |
Total |
| Sensible
|
| Sleep |
57.9 |
8 |
463 |
57.9 |
8 |
463 |
57.9 |
8 |
463 |
| Light wk |
90.7 |
8 |
725 |
79.3 |
8 |
635 |
68.0 |
8 |
544 |
| Mod wk |
94.5 |
8 |
756
|
81.9 |
8 |
655 |
68.0 |
8 |
544
|
| Total |
|
|
1944 |
|
|
1753 |
|
|
1551 |
| Latent
|
| Sleep |
17.6 |
8 |
141 |
17.6 |
8 |
141 |
17.6 |
8 |
141 |
| Light wk |
22.7 |
8 |
182 |
34.0 |
8 |
272 |
45.3 |
8 |
363 |
| Mod wk |
44.1 |
8 |
352 |
56.7 |
8 |
453 |
70.5 |
8 |
564 |
| Total |
|
|
675 |
|
|
866 |
|
|
1068
|
| Total metabolic rate(Kcal/man-day) |
|
|
2619 |
|
|
2619 |
|
|
2619 |
| Normal metabolic load |
| Sensible |
| Sleep |
57.9 |
8 |
463 |
57.9 |
8 |
463 |
57.9 |
8 |
463 |
| Light wk |
90.6 |
5 |
453 |
79.3 |
5 |
397 |
68.0 |
5 |
340 |
| Mod wk |
94.5 |
9 |
850 |
81.9 |
9 |
737 |
68.0 |
9 |
612 |
| Heavy wk |
98.2 |
2 |
196 |
84.4 |
2 |
169 |
68.0 |
2 |
136 |
| Total |
|
|
1962 |
|
|
1766 |
|
|
1551 |
| Latent |
| Sleep |
17.6 |
8 |
141 |
17.6 |
8 |
141 |
17.6 |
8 |
141 |
| Light wk |
22.7 |
5 |
114 |
34.0 |
5 |
170 |
45.3 |
5 |
227 |
| Mod wk |
44.1 |
9 |
397 |
56.7 |
9 |
510 |
70.5 |
9 |
635 |
| Heavy wk |
103.2 |
2 |
207 |
117.1 |
2 |
234 |
133.5 |
2 |
267 |
| Total |
|
|
859 |
|
|
1055 |
|
|
1270 |
| Total metabolic rate(Kcal/man-day) |
|
|
2821 |
|
|
2821 |
|
|
2821 |
| High Metabolic load |
| Sensible |
| Sleep |
57.9
|
8 |
463 |
57.9 |
8 |
463 |
57.9 |
8 |
463 |
| Light wk |
90.6 |
4 |
362 |
79.3 |
4 |
317 |
68.0 |
4 |
272 |
| Mod wk |
94.5 |
4 |
378 |
81.9 |
4 |
328 |
68.0 |
4 |
272 |
| Heavy wk |
98.2 |
8 |
786 |
84.4 |
8 |
675 |
68.0
|
8 |
544
|
| Total |
|
|
1989 |
|
|
1783 |
|
|
1551 |
| Latent |
| Sleep |
17.6 |
8 |
|
17.6 |
8 |
141 |
17.6 |
8 |
141 |
| Light wk |
22.7 |
4 |
91 |
34.0 |
4 |
136 |
45.3 |
4 |
181 |
| Mod wk |
44.1 |
4 |
176 |
56.7 |
4 |
227 |
70.5 |
4 |
281 |
| Heavy wk |
103.1 |
8 |
827 |
117.1 |
8 |
937 |
133.5 |
8 |
1068 |
| Total |
|
|
1234 |
|
|
1441 |
|
|
1673 |
| Total metabolic rate
(Kcal/man-day) |
|
|
3224 |
|
|
3224 |
|
|
3224 |
Reference: 348, Table 3, p, 12; NASA-STD-3000 293, Rev. A
Figure 5.8.2.2.5-1 Metabolic Heat Generation Matrix English Units (Concluded)
Metabolic Heat Generation Matrix English Units
| Low metabolic load |
| Cabin temperature |
65°F |
70°F |
75°F |
| |
Kcal/hr |
hrs |
Total |
Kcal/hr |
hrs |
Total |
Kcal/hr |
hrs |
Total |
| Sensible |
| Sleep |
230 |
8 |
1840 |
230 |
8 |
1840 |
230
|
8 |
1840 |
| Light wk |
360 |
8 |
2880 |
325 |
8 |
2520 |
270 |
8 |
2160 |
| Mod wk |
375 |
8 |
3000
|
325 |
8 |
2600
|
270 |
8 |
2160 |
| Total |
|
|
7720 |
|
|
6960 |
|
|
6160 |
| Latent |
| Sleep |
70 |
8 |
560 |
70 |
8 |
560 |
70 |
8 |
560 |
| Light wk |
90 |
8 |
720 |
135
|
8 |
1080 |
180 |
8 |
1440 |
| Mod wk |
175 |
8 |
1400 |
225 |
8 |
1800 |
280 |
8 |
2240 |
| Total |
|
|
2680 |
|
|
3440 |
|
|
4240 |
| Total metabolic rate (Btu/man-day) |
|
|
10,400 |
|
|
10,400 |
|
|
10,400 |
| Normal metabolic load |
| Sensible |
| Sleep |
230 |
8 |
1840 |
230 |
8 |
1840 |
230 |
8 |
1840 |
| Light wk |
360 |
5 |
1800 |
315 |
5 |
1575 |
270 |
5 |
1350 |
| Mod wk |
375 |
9 |
3375 |
325 |
9 |
2925 |
270 |
9 |
2430 |
| Heavy wk |
390 |
2 |
780 |
335 |
2 |
670 |
270 |
2 |
540 |
| Total |
|
|
7795 |
|
|
7010 |
|
|
6160 |
| Latent |
| Sleep |
70 |
8 |
560 |
70 |
8 |
560 |
70 |
8 |
560 |
| Light wk |
90 |
5 |
450 |
135 |
5 |
675 |
180 |
5 |
900 |
| Mod wk |
175 |
9 |
1575 |
225 |
9 |
2025 |
280 |
9 |
2520 |
| Heavy wk
|
410 |
2 |
820 |
465 |
2 |
930 |
530 |
2 |
1060 |
| Total |
|
|
3405 |
|
|
4190 |
|
|
5040 |
| Total metabolic rate (Btu/man-day) |
|
|
11,200 |
|
|
11,200 |
|
|
11,200 |
|
High Metabolic load |
| Sensible |
| Sleep |
230 |
8 |
1840 |
230 |
8 |
1840 |
230 |
8 |
1840 |
| Light wk |
360 |
4 |
1440 |
315 |
4 |
1260 |
270
|
4 |
1080 |
| Mod wk |
375 |
4 |
1500 |
325 |
4 |
1300 |
270 |
4 |
1080 |
| Heavy wk |
390
|
8 |
3120
|
335 |
8 |
2680 |
270 |
8 |
2160 |
| Total |
|
|
7900 |
|
|
7080 |
|
|
6160 |
| Latent |
| Sleep |
70 |
8 |
560 |
70 |
8 |
560 |
70 |
8 |
560 |
| Light wk |
90 |
4 |
360 |
135 |
4 |
540 |
180 |
4 |
720 |
| Mod wk |
175 |
4 |
700 |
225 |
4 |
900 |
280 |
4 |
1120 |
| Heavy wk |
4 10 |
8 |
3280 |
465 |
8 |
3720 |
530 |
8 |
4248 |
| Total |
|
|
4900 |
|
|
5720 |
|
|
6640 |
| Total metabolic rate (Btu/man-day) |
|
|
12,800 |
|
|
12,800 |
|
|
12,800 |
Reference: 348, Table 3, p, 12; NASA-STD-3000
293a
Special consideration in a space module should be given to the following areas:
a. Exercise Station - This area should have an increase in airflow in order to increase heat transfer and to relieve sweat accumulation. Individual airflow units with air temperature control will help the crewmember match the airflow to the activity. The direction of airflow should not blow sweat into other station areas, particularly eating or sleeping stations, and should blow over the entire body, not just one part.
b. Sleeping Station - Individually adjustable airflow controls are desirable.
c. Eating Station - Airflow should not blow loose morsels of food away from crewmembers so swiftly that they cannot be recovered.
d. Ventilator Intakes - Ventilation system intakes should be accessible to crew for recovery of lost objects. Airflow in the vicinity of the inlets should not exceed 0.2 m/sec (40 ft/min).
The ventilation rates used in the cabin should be sufficient to control local air contamination by body products or from noxious substances in the compartment. The cabin ventilation airflow should be sufficient to dilute contaminants and divert them from the crewmembers.
In summary, the thermal comfort design objectives are that body thermal storage be zero, that evaporative heat losses be limited to insensible evaporation of moisture produced only by respiration and diffusion through the skin without the activity of the sweat glands, and that body and skin temperatures be maintained near the normal values of 37°C (98.6°F) and 33° to 34°C (91.5° to 93.5°F) for a resting person.
5.8.3 Thermal Environment Design Requirements
{A}
Paragraphs 5.8.3.1 and 5.8.3.2 provide the design requirements for spacecraft cabin thermal environments.
5.8.3.1 Temperature, Humidity, and Ventilation Design Requirements
{A}
The following design requirements shall apply to the thermal environment:
a. Atmospheric Parameters - The atmospheric temperature, humidity, and ventilation rates shall meet the requirements in
Figure 5.8.3.1-1 (these values are shown graphically in
Figure 5.8.3.1-2)
Figure 5.8.3.1-1 Atmosphere Thermal
Comfort Requirements
| Parameter |
Units |
Operational |
28-day emergency |
| Temperature (1) |
° F |
65-80 |
60-85 |
| Dew Point (2) |
° F |
40-60 |
35-70 |
| Ventilation |
ft/min |
15-40 |
10-200 |
|
|
SI Units |
|
| Temperature (1) |
° K |
292 |
300 |
289 |
303 |
| Dew Point (2) |
° K |
278 |
289 |
274 |
294 |
| Ventilation |
m/sec |
.08 |
.20 |
.05 |
1.0 |
| Temperature (1) |
° C |
19 |
27 |
16 |
30 |
| Dew Point (2) |
° C |
5 |
16 |
1 |
21 |
|
Notes:
(1) In the operational mode temperature will be selectable ±1.1 °C (±2 °F) throughout the range
(2)
Relative humidity shall be within the range of 25 - 75 percent.
|
Reference: 5, Figure 83, p. 302; 324,
Table 2-9; NASA-STD-3000 136
Figure 5.8.3.1-2 14.7 psia Standard
Atmosphere Parametric Limits - Dry Bulb, Dew Point, Relative Humidity
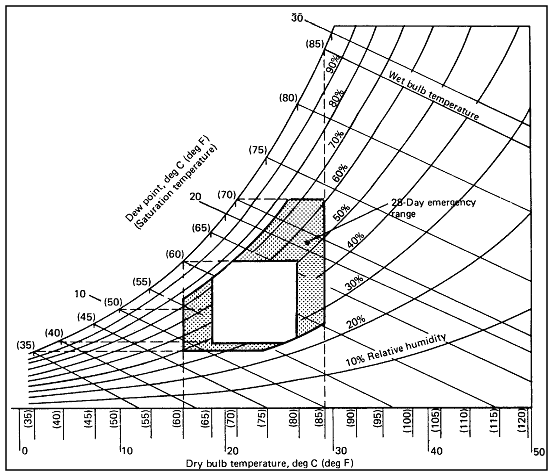
Reference: 278, Figure C-20; 324,
Table 2-9; NASA-STD-3000 137
5.8.3.2 Thermal Monitoring and Control Design Requirements
{A}
The following requirements shall apply to the monitoring and control of the space cabin thermal environment:
(Refer to Paragraph 9.3, Controls, and
Paragraph 9.4, Displays, for specific details on control and display requirements)
a. Monitoring of Thermal Environment -
1. Monitoring of cabin temperature and relative humidity shall be provided.
2. Monitoring of the thermal environment shall be fully automatic. The number, type, and location of temperature sensors and the frequency of monitoring shall be such as to ensure measurement of representative cabin temperature and to allow stable control of those temperatures.
3. Visual and audible alarms shall be automatically initiated when thermal parameters exceed the limits given in
Paragraph 5.8.3.1.
(Refer to Paragraph 9.4.4, Caution and Warning Displays, for specific requirements for implementing the caution and warning system.)
b. Adjustment of Thermal Environment by the Crew - Crewmembers shall be provided with controls that allow them to modify temperatures, humidity, and ventilation rates inside the space module within the ranges for these parameters as specified in
Paragraph 5.8.3.1.
c. Sleep Compartment, Personal Hygiene Area, and Waste Management Compartment Thermal Environment Controls - Temperature and ventilation shall be maintained in each of the private crew quarters, the personal hygiene area, and the waste management compartment, and shall be controlled in each of these areas within the range of these parameters.
d. Portable Fans - If activity stations are isolated from the module air circulation systems, auxiliary airflow and/or portable fans shall be provided.
e. Exercise Station Perspiration Control - Each exercise station shall be provided with a method of sweat removal and collection.
5.9 COMBINED ENVIRONMENTAL EFFECTS
{A}
5.9.1 Introduction
{A}
This section provides design considerations and requirements for combined environments.
5.9.2 Combined Environmental Effects Design Considerations
{A}
In the previous subsections, the physical environments (acceleration, vibration, thermal, etc.), human responses to these environments, and the environmental design limits that are based on these human responses, have been given as if each of the physical environments existed by itself. In aerospace operational environments this is rarely, if ever, the case. The space module and its crewmembers are exposed to an intricate interplay of several of these environments. For example, during launch, the crewmembers are subjected to the simultaneous stresses of linear and angular rotation, vibration, and noise.
Data that define the design requirements for combined environmental effects are virtually nonexistent. Relatively few laboratory studies have been devoted to the investigation of tolerance levels, physiological effects, or performance effects during exposure to two environmental stressors. There are even fewer studies involving three or more stressors.
The following figures summarize some of the research findings on the physiological effects of combined environmental stressors. The reader is cautioned to be aware that in these figures there are apparent contradictory findings. This may be due to one researcher having concentrated on a single combination of environmental parameters and reflecting the findings specific to these parameters, whereas, another researcher has examined a range of combinations of environmental parameters, resulting in more generalized conclusions. This emphasizes why this kind of combined stressor data must be used with caution.
Figure 5.9.2-1 contains some examples of how certain physical environments affect physiological functions.
Figure 5.9.2-1 Common Mechanisms
of Action of Selected Environmental Stress
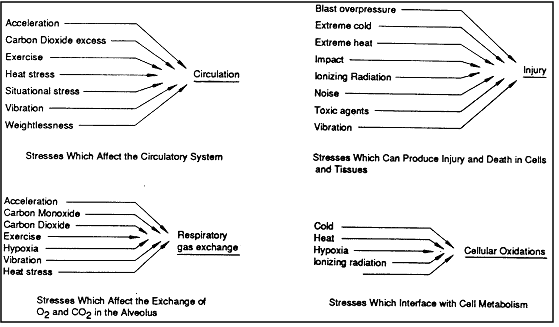
Textual representation:
Stresses that affect the circulatory system:
Acceleration, Carbon Dioxide excess, exercise, heat stress, situational stress,
vibration, weightlessness.
Stresses that can produce injury and death in cells
and tissues: Blast overpressure, extreme cold, extreme heat, impact,
ionization radiation, noise, toxic agents, vibration.
Stresses that affect the exchange of O2
and CO2 in the Alveolus (respiratory gas exchange):
Acceleration, Carbon Monoxide, Carbon Dioxide, exercise, hypoxia, vibration,
heat stress.
Stresses that interfere with cell metabolism and can
lead to cellular oxidations: cold, heat, hypoxia, ionizing radiation.
|
Reference: 92, Figure 19-1; NASA-STD-3000 37
Figure 5.9.2-2 describes the experimental findings on combined environmental stresses when acceleration is the primary stressor.
Figure 5.9.2-2 Combined Stress -
Acceleration the Primary Stressor
| Stresses |
Test Animal |
Measures |
Effect |
Physiological Interaction |
|---|
|
Acceleration and hypoxia
|
Man
|
G - tolerance (peripheral light loss)
|
Hypoxia decreases +Gz tolerance
|
Additive
|
|
Acceleration (angular) and hypoxia
|
Man
|
Nystagmus
|
Hypoxia causes smaller change in nystagmus than apprehension
|
None
|
|
Acceleration and heat/cold
|
Man
|
G tolerance (peripheral light loss)
|
Heat lowers G tolerance. Cold raises G tolerance
|
Additive, synergistic
|
|
Acceleration and heat
|
Man
|
G tolerance (peripheral light loss)
|
Heat lowers G tolerance
|
Additive
|
|
Acceleration and
heat/cold
|
Mice
|
Survival time
|
High environmental temperature decreases and cold increases the tolerance of mice to positive acceleration
|
Additive, antagonistic
|
|
Acceleration (vertical tilt and heat)
|
Man
|
Heart rate, forearm blood flow, blood pressure, rectal temperature
|
Heat lowers tilt tolerance. Heart rate is higher, blood pressure is lower, and syncope is more common in heat
|
Additive
|
|
Acceleration and cold
|
Rats
|
Survival time
|
Hypothermia (22.5 deg C) improves tolerance to -Gz at levels of 30-40G
|
Antagonistic
|
|
Acceleration and heat
|
Man
|
Peripheral light loss
|
Prior heat stress producing minimal dehydration (1-3% body weight) decreases acceleration tolerance 15 - 18%
|
Additive
|
|
Acceleration and dehydration
|
Man
|
Peripheral light loss
|
Prior heat stress producing dehydration decreases acceleration tolerance
|
Additive
|
|
Acceleration and hyperoxia
|
Man
|
Pulmonary function tests
|
Breathing 100% O2 during acceleration does not interact with tolerance but does ameliorate acceleration-induced atelectasis
|
Variable
|
Reference: 92, Table 19 -1 NASA-STD-3000 38
Figure 5.9.2-3 describes the experimental findings on combined environmental stresses when vibration is the primary stressor.
Figure 5.9.2-3 Combined Stress -
Acceleration the Primary Stressor
| Stresses |
Test Animal |
Measures |
Effect |
Physiological Interaction |
Vibration and acceleration |
Man |
Whole body mechanical impedance
|
Vibration (+0.4G at 2.5-20 Hz) combined with linear acceleration (1,
2 1/2, and 4G) produces increased stiffness, reduces damping, and increases
energy transmission to internal organs |
Additive |
Vibration and acceleration
|
Man |
Compensatory tracking task |
Vibration (0 - +3.0G at 11 Hz) combined with linear acceleration (1
- 3.5G) produces performance decrements not significantly different from
vibration alone |
None |
Vibration and heat |
Rats |
Mortality
|
Incidence of mortality (62%) is greater after 20 min exposure to heat
(46.1 deg C) and random vibration (5-800 Hz 17.5G RMS) in combination
than singly |
Additive |
Vibration and hypoxia |
Rats |
Mortality
|
Mortality of restrained rats increases directly with hypoxia (altitude
8-18,000 ft) during +Gx vibration (60 Hz 15G peak acceleration) |
Additive |
Vibration and pressure breathing |
Mouse |
Mortality, tissue change |
Pressure breathing ( 4 in. H2O) reduces mortality of mice
exposed to 10 min of 20 Hz random vibration (7.07G RMS) |
Antagonistic |
Vibration and acceleration |
Man |
Visual performance
|
(+3.85Gx) acceleration improves the visual performance
decrement associated with (11 Hz ± Gx) vibration |
Antagonistic |
Vibration and carbon dioxide |
Man |
Ventilation |
+Gz vibration (40 Hz) and increased inspired CO2
both increase ventilation but are not additive in combination |
None |
Vibration and noise |
Man |
Physiological measures, performance |
+Gz vibration (semirandom) (.16-.4 RMSg) and noise (~112dB)
have no significant effect on multiple performance measures or physiological
responses in simulated helicopter flight |
None |
Vibration and noise and temperature |
Primate, man |
Sleep-stage EEG, performance |
+Gz vibration (.7RMS), noise (102 dB), and heat (90 deg
F) in combination produce significant sleep disturbance and performance
decrement (shock avoidance) |
Additive |
Vibration and noise |
Man |
Performance (compensatory
tracking and reaction time) |
Noise (100 dB) and vibration (0.25 +Gz, 5 Hz) produce additive
decrement in vertical component of compensatory tracking task |
Additive
|
Vibration and drugs |
Mice |
Mortality, tissue damage |
Mortality is decreased significantly by CNS depressant and increased
by CNS stimulants |
Not examined |
Reference: 92, Table 19-2 NASA-STD-3000 39
Figure 5.9.2-4 describes the experimental findings on combined environmental stresses when noise is the primary stressor.
Figure 5.9.2-4 Combined Stress-Noise
the Primary Stressor
| Stresses |
Test Animal |
Measures |
Effect |
Physiological interaction |
Noise and heat |
Man |
Performance task battery |
Noise (90 dB) and heat (87 deg ET) produce no significant performance
decrement, singly or in combination |
None |
| Noise and heat and sleep deprivation |
|
Performance (tracking and serial reaction) |
See Figure 5.9.2-5 |
Heat and noise-none; noise and sleep deprivation-antagonistic |
| Noise and vibration |
Man |
Performance |
See Figure 5.9.2-3 |
Additive |
| Noise and vibration |
Man |
Performance, physiological measures |
See Figure 5.9.2-3 |
None |
| Noise and vibration and heat |
Primate |
Sleep (EEG), performance |
See Figure 5.9.2-3 |
Additive |
| Vibration and noise |
Man
(adolescent boys) |
Sensitivity to vibration |
Results vary widely with time of day and work experience with vibration.
In general, vibration causes decrease in sensitivity. Exposure to noise
and vibration varies but prolonged exposure to both causes a greater decrease
in sensitivity |
Not examined |
Reference: 92, Table 19 -3; NASA-STD-3000 40
Figure 5.9.2-5 provides a summary of the effects of heat, noise, and sleep deprivation on performance.
Figure 5.9.2-5 Summary of the Effects
of Heat, Noise, and Sleep Deprivation on Performance
| Stress |
Speed |
Errors |
Place where work period where effect appears |
Effect of incentives |
Physiological interaction |
| Heat |
Noise |
| Heat |
No effect |
Increased |
Throughout |
(No effect) * |
--- |
None |
| Noise |
No effect** |
Increased** |
End** |
Impairs performance |
(None) |
--- |
| Sleep deprivation |
Reduced** |
No effect** |
End** |
No effect or improved |
None |
Reduced effect (antagonistic) |
|
Notes:
* Results in brackets not from the serial reaction test and not strictly comparable
** Based on the results of more than one day one study and felt to be more reliable.
|
Figure 5.9.2-6 describes the experimental findings on combined environmental stresses when simulated weightlessness (bed rest or water immersion) is the primary stressor.
Figure 5.9.2-6 Combined Stress
- Simulated Weightlessness the Primary Stressor
| Stresses |
Test Animal |
Measures |
Effect |
Physiological interaction |
| Bed rest and hypoxia |
Man |
Orthostatic tolerance, blood volume, metabolism |
Hypoxia (10,000 ft simulated attitude) prevents changes in red cell mass and calcium metabolism associated with bed rest |
Antagonistic |
| Bed rest and heat |
Man |
Tilt table tolerance |
Heat ( 95 deg C) and 48 hr of bed rest produced greater orthostatic intolerance in combination than alone
|
Additive
|
|
Bed rest and water immersion (sequential)
|
Man
|
Tilt table tolerance
|
Not defined. Subjects at bed rest at night and immersed by day to simulate deconditioning effects of prolonged weightlessness
|
Not defined
|
|
Bed rest/immersion and acceleration
|
Man
|
Tolerance to +Gx, +Gz acceleration
|
Tolerance to +Gz slow onset acceleration is reduced by prior bed rest or immersion exposure
|
Not defined
|
|
Immersion acceleration (sequential)
|
Man
|
tolerance to +Gz acceleration
|
+Gz tolerance reduced in one subject after 5 days of water immersion
|
Not defined
|
Reference: 92, Table 19-5 NASA-STD-3000 42
Figure 5.9.2-7 describes the experimental findings on combined environmental stresses when cold temperature is the primary stressor.
Figure 5.9.2-7 Combined Stress-Cold
Temperature the Primary Stressor
Combined Stress-Cold Temperature the Primary Stressor
Stresses
|
Test Animal
|
Measures
|
Effect
|
Physiological
interaction
|
|---|
|
Cold and
acceleration
|
|
|
See Figure 5.9.2-2
|
|
|
Cold and hypoxia
|
|
|
See Figure 5.9.2-9
|
|
|
Cold and ionizing radiation
|
Rats
|
Survival time
|
Both neutron (220 rad) and X-ray (430 rad) decreases survival time of rates at -20 deg C
|
Not defined
|
|
Cold and ionizing radiation
|
Rats
|
Survival time, lesions
|
The reduced longevity, retarded growth, cataracts, and skin ulcers seen after 500R X irradiation is not altered by 3-hr daily exposure to 32 deg F (0 deg C)
|
None
|
|
Cold and alcohol
|
Man
|
Skin and rectal temperature, heat production
|
Alcohol does not significantly alter thermal responses to 8 hr Sleep in cold (20 deg C)
|
Not examined
|
|
Cold and hypoxia
|
Mice
|
Survival time
|
Survival time in 100% O2 normally > 120 hr is reduced to < 72 hr in cold (4 deg C)
|
Not examined
|
Reference: 92, Table 19-6 NASA-STD-3000 43
Figure 5.9.2-8 describes the experimental findings on combined environmental stresses when heat is the primary stressor.
Figure 5.9.2-8 Combined Stress-Heat
the Primary Stressor
Stresses
|
Test animal
|
Measures
|
Effect
|
Physiological interaction
|
|---|
|
Heat and acceleration
|
Man,
mice
|
Tolerance,
survival
|
See Figure 5.9.2-2
|
|
|
Heat and hypoxia
|
Man
|
---
|
See Figure 5.9.2-9
|
|
|
Heat and vibration
|
Man,
primate
|
Sleep EEG
|
Combination of heat ( 90 deg F) and sinusoidal vibration reduces amount of REM sleep
|
Not defined
|
|
Heat and vibration
|
|
|
See Figure 5.9.2-3
|
Additive
|
|
Heat and noise
|
Man
|
Performance (tracking and monitoring), heart and respiration rates, body and skin temperature
|
Temperatures as high as 110 deg F (50% RH) and noise (110 dB) produce no significant degradation in performance or physiological thermal equilibrium
|
None
|
|
Heat and radiation
|
Dogs
|
Rectal temperature thyroid function
|
X irradiated (270 - 1800R) dogs are unable to maintain thermal balance during 6 hr exposure to (105 deg F) heat
|
Not identified
|
|
Heat and microwave radiation
|
Dogs
|
Rectal temperature
|
Dogs surviving the lethal effects of X irradiation were less able to tolerate the thermal effects of microwaves
|
Not identified
|
|
Heat and hypoxia
|
Mice
|
Survival time, histopathology
|
Survival time in 100% O2 normally > 120 hr was reduced to < 72 hr in heat
(34 deg C)
|
Not identified
|
|
Heat and vibration
|
|
Rectal temperature
|
Rectal temperature (TR), rose in proportion to degree of heat stress. Vibration (up to 15 G ) lowered TR. Combined stress interacted by synergism: TR rose in proportion to degree of vibration stress
|
|
Reference: 92, Table 19-7 NASA-STD-3000 44
Figure 5.9.2-9 describes the experimental findings on combined environmental stresses when hypoxia is the primary stressor.
Figure 5.9.2-9 Combined Stress -
Hypoxia the Primary Stressor
Stresses
|
Test animal
|
Measures
|
Effect
|
Physiological
interaction
|
|---|
|
Hypoxia and heat and noise
|
Man
|
Performance
(compensatory tracking), heart rate, respiration, rectal temperature
|
Heat (105 deg F), noise (110 dB white noise), and hypoxia (12000 ft equiv.) studied in pairs or all three together show additive interactions
|
Additive
|
|
Hypoxia and cold
|
Man
|
Tolerance time, peripheral light loss
|
Rapid collapse and delayed recovery
|
Additive
|
|
Hypoxia and acceleration
|
Man
|
tolerance time, peripheral light loss
|
Hypoxia decreases + Gz tolerance
|
Additive
|
|
Hypoxia and heat
|
Man
|
Heart rate
|
Heat (149 deg C) and hypoxia
(PO2100 mm Hg) increase heart rate at 15 exposure 10 and 7 bpm respectively and 17 bpm when combined. No significant interaction is seen in other variables (skin and rectal temp, blood pressure, ventilation, and oxygen consumption). Initial synergistic interaction becomes antagonistic after 30 min.
|
Synergistic and antagonistic
|
|
Hypoxia and Izoning radiation
|
Rats
|
Tolerance (survival)
|
Prior whole body X irradiation improves survival rates for acute 25 - to 30,000 - ft altitude exposure
|
Antagonistic
|
|
Hypoxia and cold
|
Man
|
Shivering, heart rate, oxygen consumption
|
Hypoxia (10% inspired O2) during cold ( 5 deg C) inhibits shivering and lowers heat production
|
Additive
|
|
Hypoxia an vibration
|
Rats
|
Mortality
|
Mortality of restrained rats increases directly with hypoxia (8- to 18,000-ft attitude +Gx vibration (60 Hz 15 peak acceleration)
|
Additive
|
|
Hypoxia and alcohol
|
Man
|
Visual acuity, performance
|
Combined effect of hypoxia and alcohol greater than simple sum of the (decreased) acuity produced by each
|
Additive
|
|
Hypoxia and carbon monoxide
|
Man
|
Tolerance time
|
Small amounts of CO reduce tolerance to hypoxia
|
Additive
|
|
Hypoxia and hypobaria
|
Rat red
cells
|
Osmotic fragility
|
Under constant pressure, hypoxia increases RBC osmotic fragility. Under constant PO2, hypobaria increases osmotic fragility but hjypoxia and hypobaria are independent and do not interact
|
None
|
|
Hypoxia and alcohol
|
Man
|
Psychomotor performance
|
Hypoxia and alcohol combined are additive
|
Additive
|
|
Hypoxia and alcohol
|
Man
|
Flicker fusion frequency
|
Hypoxia (altitude equivalent 10,000 ft) and the ingestion of alcohol each diminish flicker fusion frequency. The effect of the combined stresses is approximately the sum of the individual effects
|
Additive
|
Reference: 92, Table 19- 8 NASA-STD-3000 45
Figure 5.9.2-10 describes the experimental findings on combined environmental stresses when ionizing radiation is the primary stressor.
Figure 5.9.2-10 Combined Stress--Ionizing
Radiation the Primary Stressor
Stresses
|
Test animal
|
Measures
|
Effect
|
Physiological interaction
|
|---|
|
Ionizing radiation and acceleration
|
Rats,
Mice
|
Survival, histopathology
|
Chronic acceleration improves radiation tolerance, acute acceleration degrades acceleration tolerance
|
Variable, complex
|
|
Ionizing radiation and decompression
|
Mice
|
Survival
|
No difference in acute survival of radiation when decompressed from air or oxygen environments. 30 d. survival less in oxygen breathing animals
|
None
|
|
Ionizing radiation and cold
|
Rats
|
Survival, tissue oxygen tension, histopathyology
|
Cold exposure (0° C) has no significant effect on radiation induced histopathology |
None |
| Ionizing radiation and heat |
Dogs |
Rectal temperature |
Both whole body and local thyroid irradiation ( 7 years prior to heat) produce measurable changes in thermoregulation response to heat stress |
Not specified |
| Ionizing radiation and hypoxia |
Rats |
Survival, hematology |
Hypoxia, both acute and chronic, is radioprotective |
Antagonistic |
| Ionizing radiation and hypoxia |
---- |
---- |
A large literature indicates the effects of radiation are enhanced by oxygen-rich atmospheres |
Synergistic |
| Radiation (ionizing) and radiation (microwave) |
Dogs |
Survival, hematology |
Mortality is greater after combined X-ray and microwave exposure than singly |
Additive |
| Ionizing radiation and vibration |
Mice |
Histopathology |
Damage to all nuclei chromosomes produced by both radiation and vibration, but interaction of the stresses is variable |
Variable (probably no significant interaction) |
| Ionizing radiation and vibration and acceleration |
Mice |
Histopathology of bon marrow cell nuclei |
Damage to cell nuclei and chromosomes pattern by radiation is reduced by prior acceleration and vibration singly or on combination |
Variable (depending on sequence of treatment) |
|
Note:
Little comparison of results across studies is possible due to lack of uniformity of type radiation, dose units, types of response studied, type of animal, etc. No attempt is made in this table to specify the nature of the radiation exposure.
|
Reference: 92, Table 19-9 NASA-STD-3000 46
Refer to Reference 92, Chapter 19, for further discussion of combined environmental effects and summary of the limited amount of data.
While there are no agreed-upon design standards for combined environmental effects, in light of the data in the figures cited above, it is prudent to consider, as a minimum, the following precautions:
a. Work Around - Avoid the assignment of critical tasks (e.g., complex cognitive tasks, complex coordination tasks, etc.) during exposure to combined stressors.
b. Exposure Beyond - When considering human exposure beyond that previously experienced extreme caution is required. Objectives should be clearly identified and maximum controls used to minimize danger.
c. Assumption of Effects - Assume neither positive or negative synergistic effects when crewmembers are exposed to multiple environmental stressors. (While adverse synergistic effects should not be assumed, they should certainly be considered.)
The process of assessing the effects of the combined environments to which the crewmember will be subjected should include careful review of each of the applicable previous sections.
d. Protective Gear - Consider the use of protective clothing and equipment, taking into account any decrements in performance that such clothing and equipment might cause.
e. Nondesign Solutions - Give careful consideration to nondesign solutions.
For example, if a critical task's performance must be of
high quality, consider recommending significant amounts
of extra training with respect to such tasks.
Return to Volume I Home


